Fig. 4.
Download original image
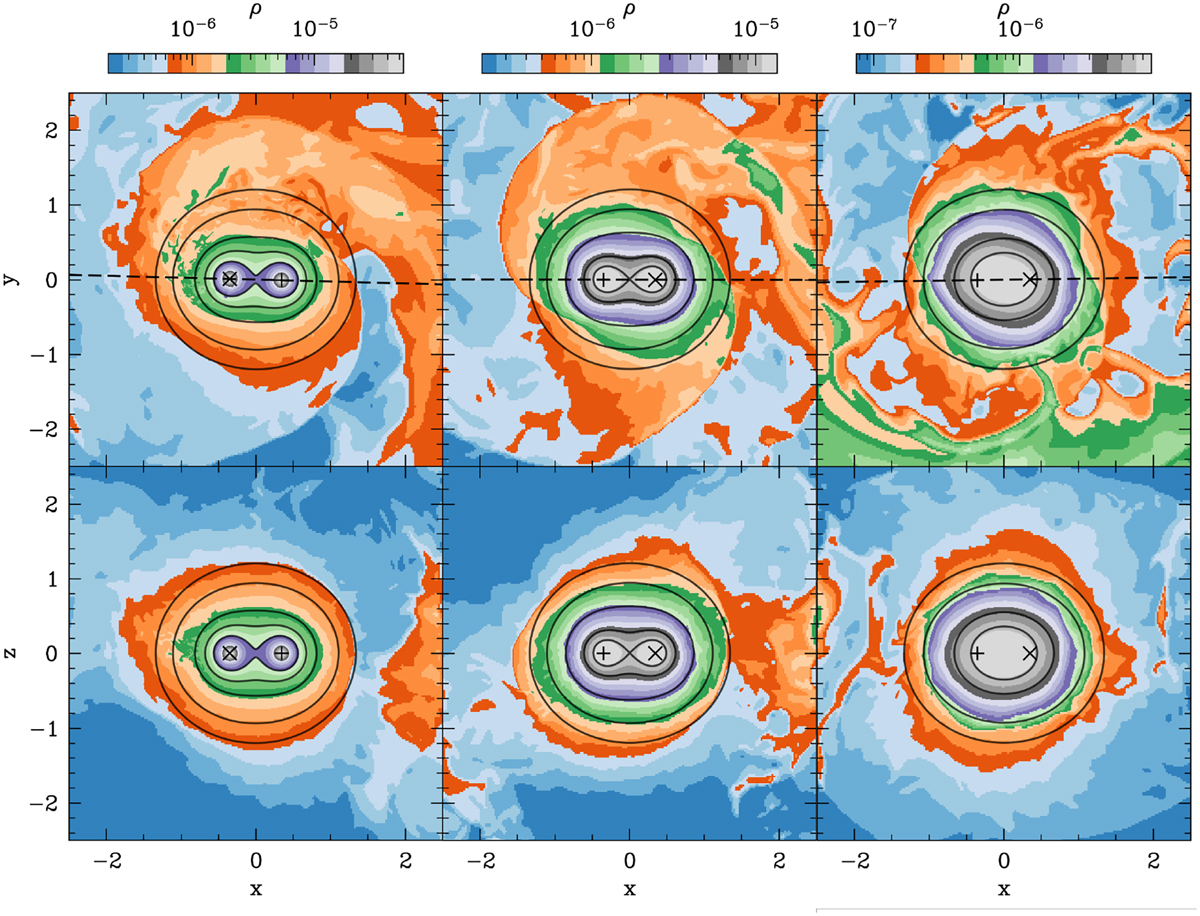
Zoomed-in snapshot of the gas density cross section in the xy (top row) and xz planes (at y=0, bottom row) after ∼2100 orbits for ϵ=0.05, 0.2, and 0.5 (from left to right) for q=1 with live orbital separation and using the spline softening method. The dashed black line illustrates the intersection between the orbital plane and the plane orthogonal to the orbital plane and parallel to the ri−rj vector.
Current usage metrics show cumulative count of Article Views (full-text article views including HTML views, PDF and ePub downloads, according to the available data) and Abstracts Views on Vision4Press platform.
Data correspond to usage on the plateform after 2015. The current usage metrics is available 48-96 hours after online publication and is updated daily on week days.
Initial download of the metrics may take a while.