Open Access
Fig. 3
Download original image
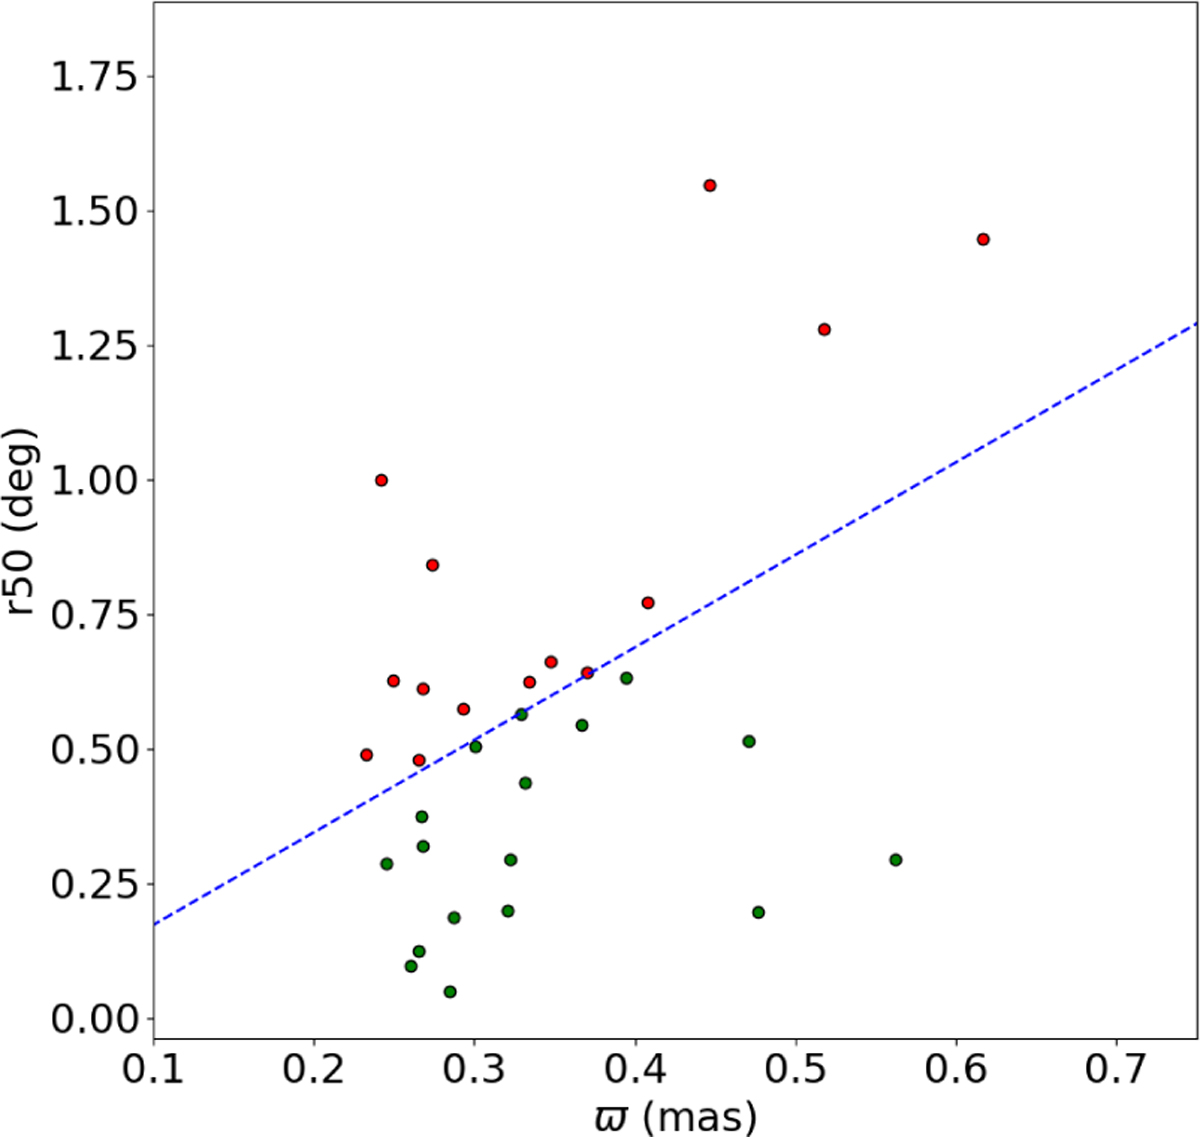
Radius containing half the cluster members as a function of their median parallax, where the blue dotted line corresponds to the equivalent radius of 30 pc. The kept groups are displayed as green dots, whilst the rejected ones are displayed as red dots.
Current usage metrics show cumulative count of Article Views (full-text article views including HTML views, PDF and ePub downloads, according to the available data) and Abstracts Views on Vision4Press platform.
Data correspond to usage on the plateform after 2015. The current usage metrics is available 48-96 hours after online publication and is updated daily on week days.
Initial download of the metrics may take a while.