Fig. 5.
Download original image
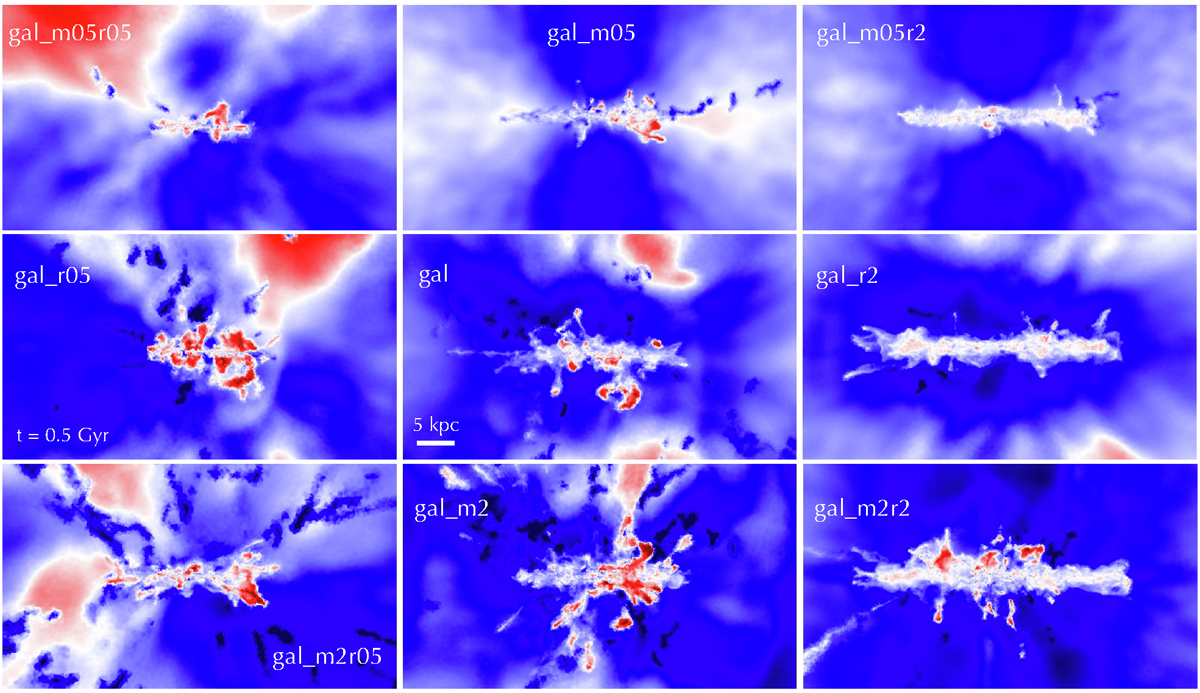
Density-weighted maps of the gas radial velocity in edge-on projections of the nine simulations at t = 0.5 Gyr. Each panel is 70 kpc × 40 kpc and with a projection depth of 70 kpc with a resolution of ∼70 pc. The velocities go from −150 km s−1 (inflows, blue) to 150 km s−1 (outflows, red) as in central panel of Fig. 4. These projections clearly show the presence of galactic fountains in the simulations.
Current usage metrics show cumulative count of Article Views (full-text article views including HTML views, PDF and ePub downloads, according to the available data) and Abstracts Views on Vision4Press platform.
Data correspond to usage on the plateform after 2015. The current usage metrics is available 48-96 hours after online publication and is updated daily on week days.
Initial download of the metrics may take a while.