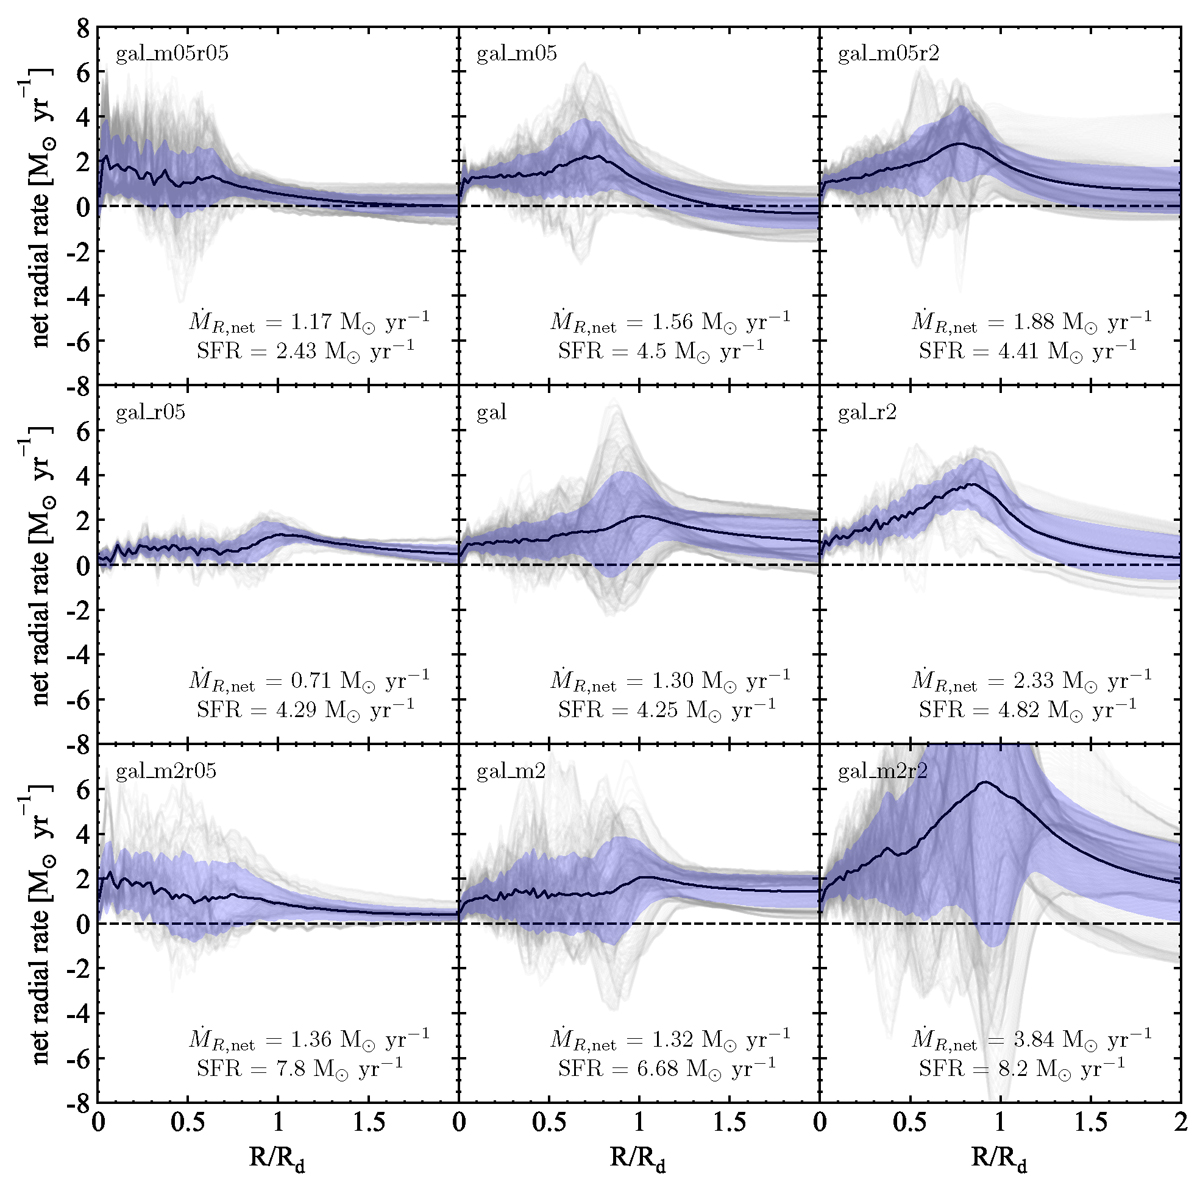
Fig. 11.
Download original image
Gas net radial mass rate for the simulations analysed in this work. In each panel, the grey lines represent the mass rate profile at a given time averaged in a time span of 100 Myr. The black line is the average mass rate and the blue shaded area represents the standard deviation. On the bottom of each panel the net radial mass rate averaged within the radial range 0 ≤ R/Rd ≤ 1 and the average SFR, computed in the temporal range 0.3 < t < 2 Gyr, are indicated.
Current usage metrics show cumulative count of Article Views (full-text article views including HTML views, PDF and ePub downloads, according to the available data) and Abstracts Views on Vision4Press platform.
Data correspond to usage on the plateform after 2015. The current usage metrics is available 48-96 hours after online publication and is updated daily on week days.
Initial download of the metrics may take a while.