Open Access
Fig. 5.
Download original image
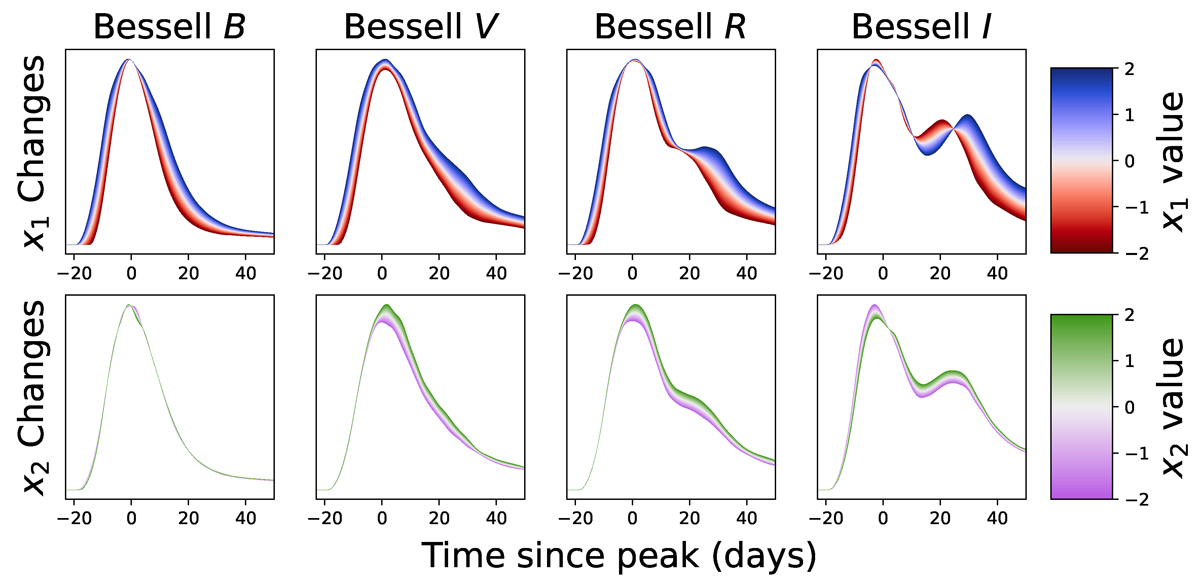
Light curves for the SALT3+ model. Upper figure shows the variation in three bands as a function of x1 with x2 fixed to 0. Lower figure shows the variation as a function of x2 with x1 fixed to 0. Any other values will be represented by a linear combination of those light curves.
Current usage metrics show cumulative count of Article Views (full-text article views including HTML views, PDF and ePub downloads, according to the available data) and Abstracts Views on Vision4Press platform.
Data correspond to usage on the plateform after 2015. The current usage metrics is available 48-96 hours after online publication and is updated daily on week days.
Initial download of the metrics may take a while.