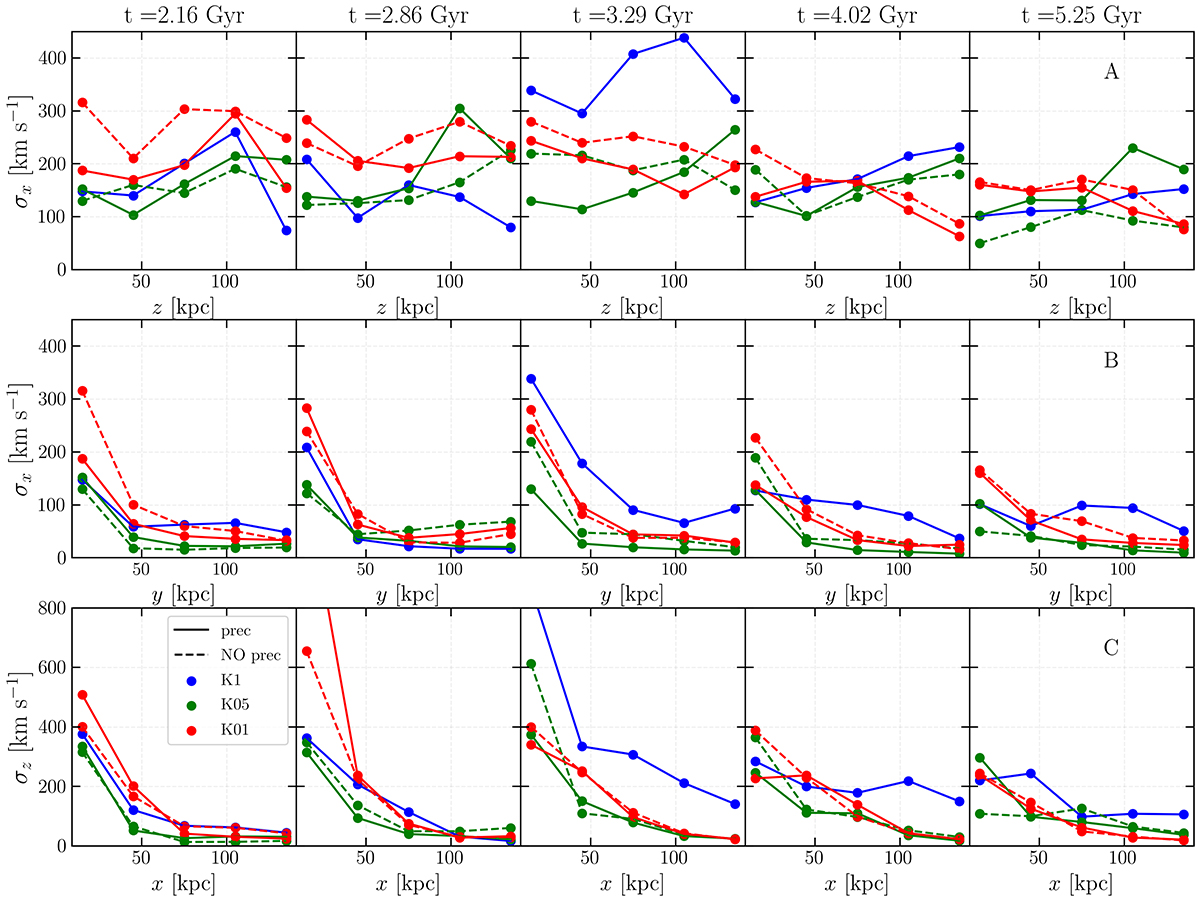
Fig. 6.
Download original image
Velocity dispersion profiles measured in pixels of 30 × 30 kpc (Eq. 10) taken along the z-axis (first row) and the y-axis (second row) for the map projected perpendicularly to the jet axis (as indicated by the black dashed lines A and B in Fig. 4) and along the x-direction (third row) for the map projected parallel to the jet axis (as indicated by the black dashed line C in Fig. 5) for runs K1 (blue solid), K05 (green solid), K05np (green dashed), K01 (red solid), and K01np (red dashed) taken at various epochs t = 2.16, 2.86, 3.29, 4.02, and 5.25 Gyr (from left to right).
Current usage metrics show cumulative count of Article Views (full-text article views including HTML views, PDF and ePub downloads, according to the available data) and Abstracts Views on Vision4Press platform.
Data correspond to usage on the plateform after 2015. The current usage metrics is available 48-96 hours after online publication and is updated daily on week days.
Initial download of the metrics may take a while.