Fig. 4.
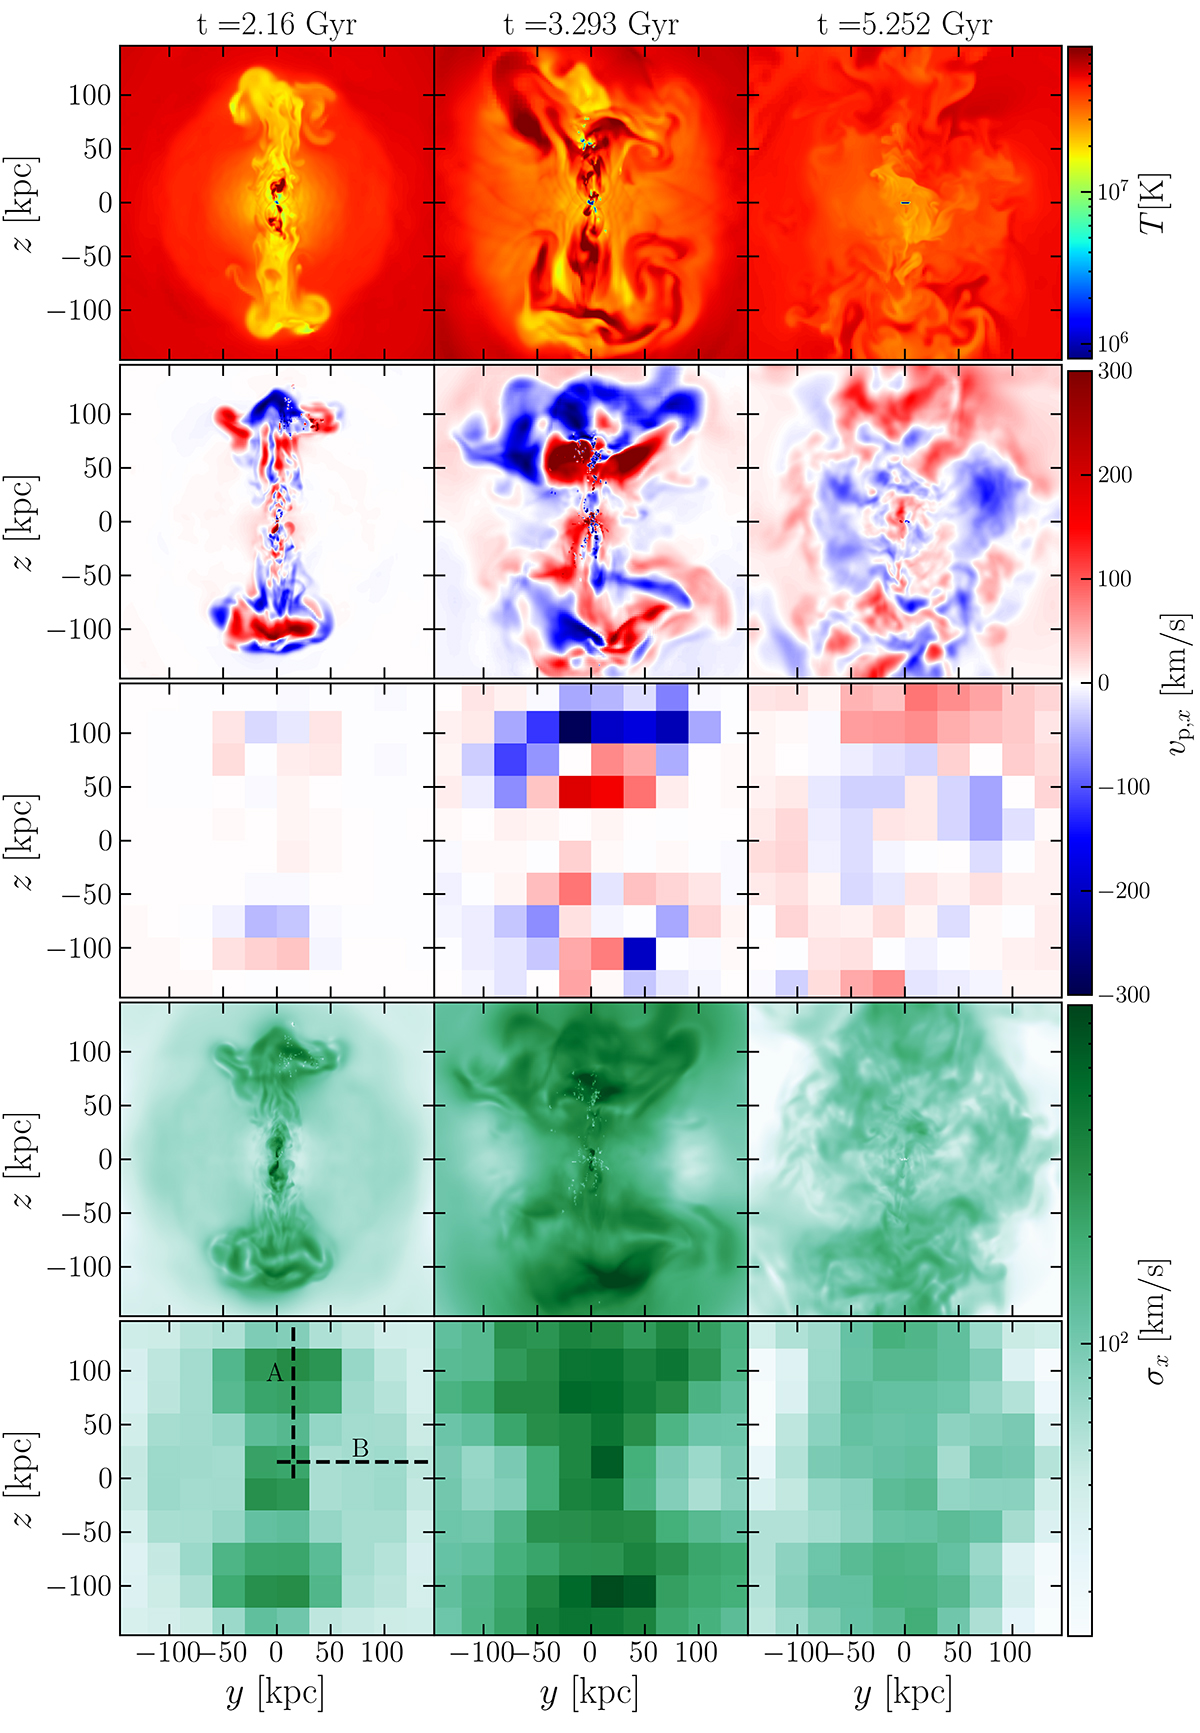
Download original image
Quantities listed in the following at three epochs (from left to right: t = 2.16, 3.29, and 5.25 Gyr) of the kinetic run with precession K1. Top panels: Temperature field in the meridional plane. Second and fourth panels: X-ray emission weighted projected velocity map and corresponding velocity dispersion obtained using Eqs. (6) and (8) along a LOS perpendicular to the jet axis. Third and fifth panels: grained X-ray emission weighted projected velocity and velocity dispersion maps obtained from Eqs. (9) and (10) using a pixel of 30 × 30 kpc along the same LOS perpendicular to the jet axis.
Current usage metrics show cumulative count of Article Views (full-text article views including HTML views, PDF and ePub downloads, according to the available data) and Abstracts Views on Vision4Press platform.
Data correspond to usage on the plateform after 2015. The current usage metrics is available 48-96 hours after online publication and is updated daily on week days.
Initial download of the metrics may take a while.