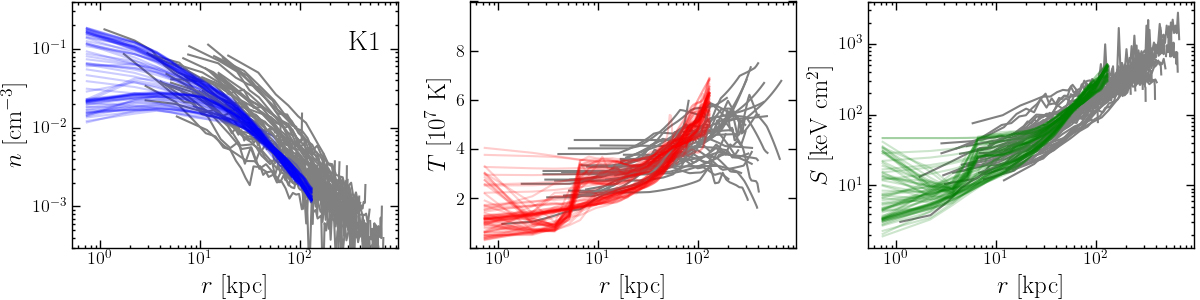
Fig. 3.
Download original image
Gas density (left), X-ray emission weighted temperature (center), and entropy radial profiles (left) obtained at several epochs during the cluster evolution in run K1. The comparison with the other runs is shown in Fig. A.1. The additional gray lines show the distribution of corresponding profiles obtained from the ACCEPT sample by Cavagnolo et al. (2009) for clusters with a central temperature in a range of 3 ≤ T ≤ 5 KeV and a central entropy less than 50 KeV/cm2 meant to select cool core cluster with masses close to the simulated Perseus-like cluster.
Current usage metrics show cumulative count of Article Views (full-text article views including HTML views, PDF and ePub downloads, according to the available data) and Abstracts Views on Vision4Press platform.
Data correspond to usage on the plateform after 2015. The current usage metrics is available 48-96 hours after online publication and is updated daily on week days.
Initial download of the metrics may take a while.