Fig. 12.
Download original image
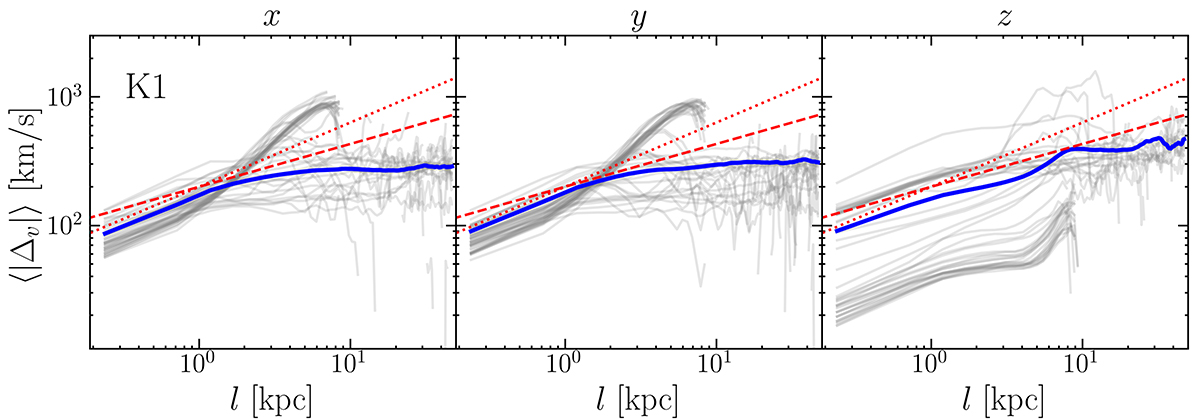
Cold gas phase VSFlos of the x, y, and z components of velocity and corresponding projection direction (from left to right), taken at all the snapshots (gray lines) of run K1. The comparison with the other runs is shown in Fig. A.4. The blue lines show the time average of all the snapshots. The dashed and dotted red lines indicate a slope of 1/3 and 1/2, respectively.
Current usage metrics show cumulative count of Article Views (full-text article views including HTML views, PDF and ePub downloads, according to the available data) and Abstracts Views on Vision4Press platform.
Data correspond to usage on the plateform after 2015. The current usage metrics is available 48-96 hours after online publication and is updated daily on week days.
Initial download of the metrics may take a while.