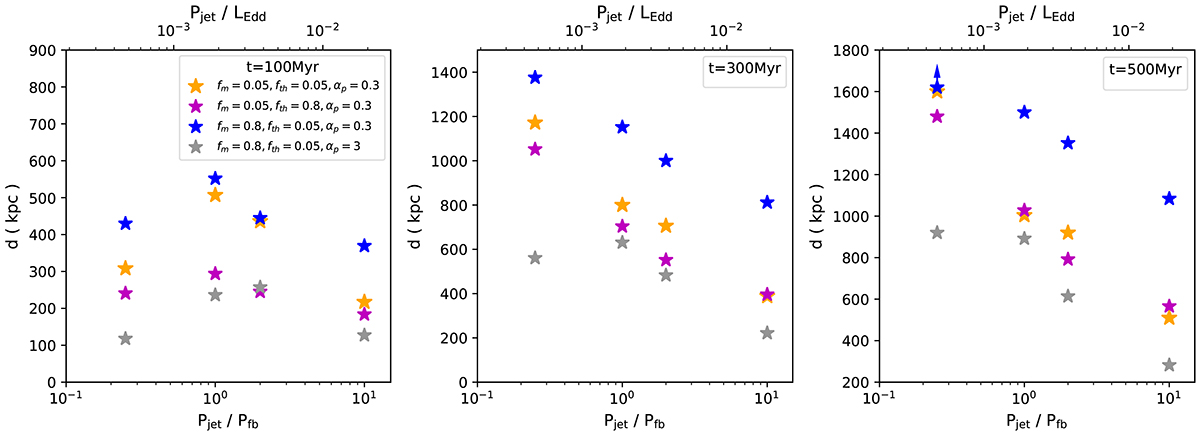
Fig. 1.
Download original image
Scales of the radio sources, d, at different times (100 Myr, 300 Myr, and 500 Myr) varying with the jet powers. We determined the scales of the radio sources by doubling the distance from the heads of the one-sided radio lobes to the center of galaxy. The stars are color-coded to represent distinct fractions of energy components and the magnetic structure parameter, αp. The arrow indicates that the source is larger than the simulated region.
Current usage metrics show cumulative count of Article Views (full-text article views including HTML views, PDF and ePub downloads, according to the available data) and Abstracts Views on Vision4Press platform.
Data correspond to usage on the plateform after 2015. The current usage metrics is available 48-96 hours after online publication and is updated daily on week days.
Initial download of the metrics may take a while.