Fig. 1.
Download original image
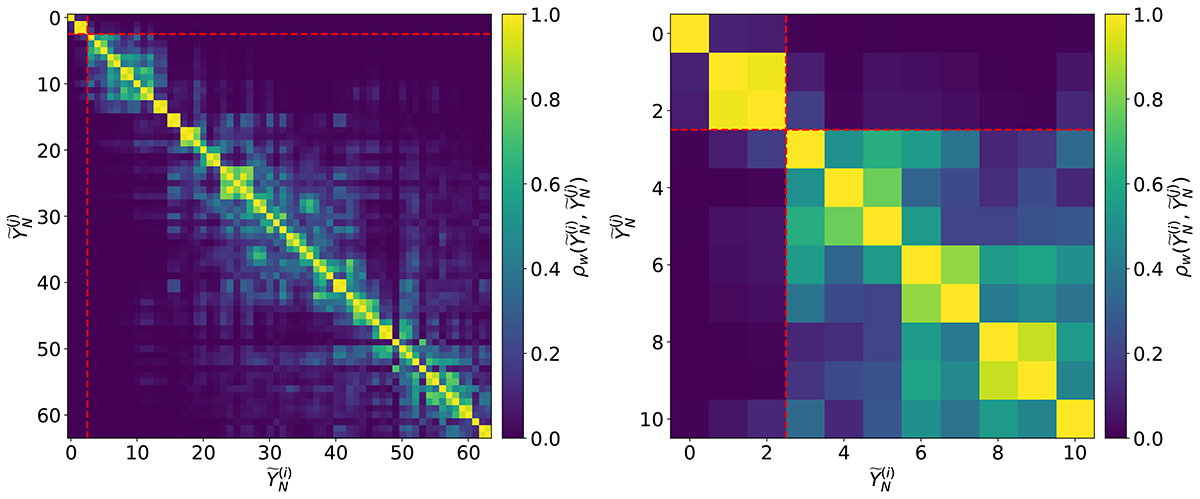
w-correlation matrices from SSA decomposition of S5 1044+71 LC. Dashed red lines separate the top-left region, containing the trend and periodic components, from the rest of the matrix, where noise components are more dominant. (Left panel) General w-correlation matrix, where each point ![]() represents the correlation between the i-th and j-th component. The color scale indicates the strength of the correlation, with yellow representing high correlation and dark purple representing low correlation. The diagonal represents self-correlation. (Right panel) Zoomed-in view focusing on the first 10 components, providing a detailed examination of the correlations between the initial components that typically capture key trends and periodic signals.
represents the correlation between the i-th and j-th component. The color scale indicates the strength of the correlation, with yellow representing high correlation and dark purple representing low correlation. The diagonal represents self-correlation. (Right panel) Zoomed-in view focusing on the first 10 components, providing a detailed examination of the correlations between the initial components that typically capture key trends and periodic signals.
Current usage metrics show cumulative count of Article Views (full-text article views including HTML views, PDF and ePub downloads, according to the available data) and Abstracts Views on Vision4Press platform.
Data correspond to usage on the plateform after 2015. The current usage metrics is available 48-96 hours after online publication and is updated daily on week days.
Initial download of the metrics may take a while.