Fig. 7.
Download original image
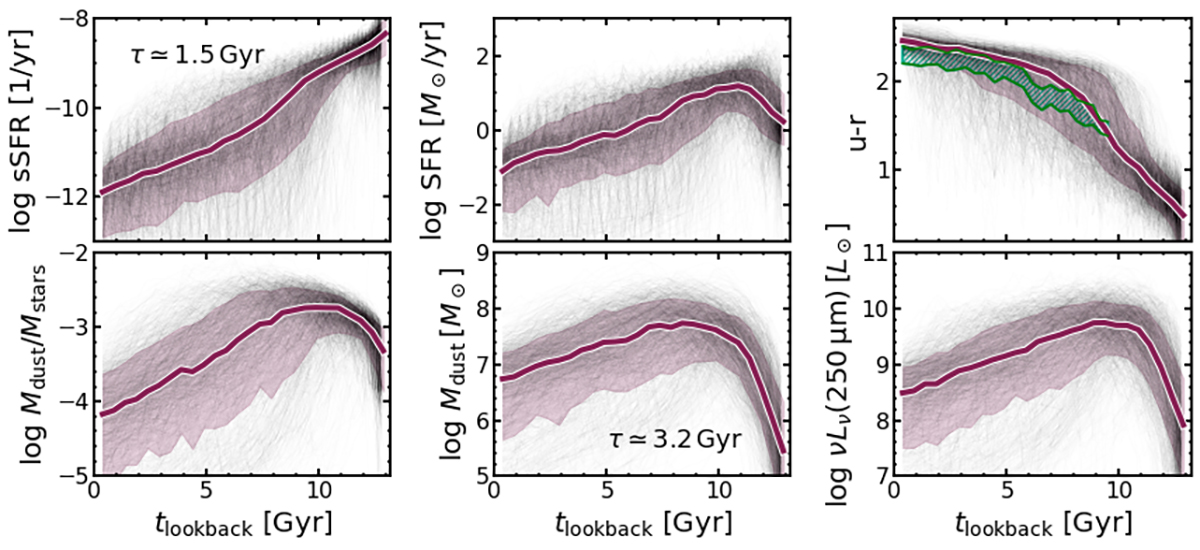
Time evolution of some key quantities for a sample of z ∼ 0 red galaxies. In clockwise order, we show the sSFR, SFR, colour u − r, νLν(250 μm), dust mass, and specific dust mass. An evolving GV (assuming the median mass evolution of the sample) is shown in the (u − r)−time plot. Tracks of individual galaxies in each diagram are shown as grey lines, and the median and 16 − 84th percentiles dispersion of all the tracks in red. Finally, we report the typical e-folding timescales associated with the (decaying) evolution of the sSFR and dust mass.
Current usage metrics show cumulative count of Article Views (full-text article views including HTML views, PDF and ePub downloads, according to the available data) and Abstracts Views on Vision4Press platform.
Data correspond to usage on the plateform after 2015. The current usage metrics is available 48-96 hours after online publication and is updated daily on week days.
Initial download of the metrics may take a while.