Fig. 6.
Download original image
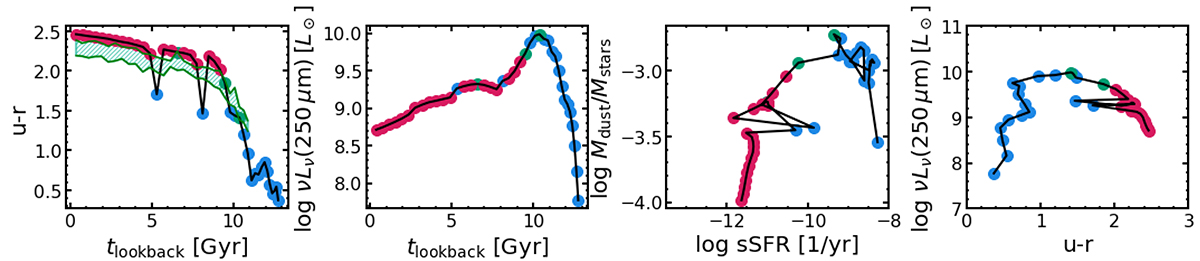
Evolution of a z ≃ 0 RS galaxy with ![]() . Left panels: Time evolution of the rest-frame colour (u − r) and νLν (250 μm). Right panels : Evolution of the galaxy in the sSFR–Mdust/Mstars and colour-νLν (250 μm) diagrams. Each point corresponds to a snapshot of the simulation and is coloured according to the galaxy position at that given time in the Mstars−colour diagram (i.e. blue, green, and red for BC, GV, and RS, respectively) according to the z-dependent GV definition given in Sect. 8. The reference GV evolution is shown in the first panel.
. Left panels: Time evolution of the rest-frame colour (u − r) and νLν (250 μm). Right panels : Evolution of the galaxy in the sSFR–Mdust/Mstars and colour-νLν (250 μm) diagrams. Each point corresponds to a snapshot of the simulation and is coloured according to the galaxy position at that given time in the Mstars−colour diagram (i.e. blue, green, and red for BC, GV, and RS, respectively) according to the z-dependent GV definition given in Sect. 8. The reference GV evolution is shown in the first panel.
Current usage metrics show cumulative count of Article Views (full-text article views including HTML views, PDF and ePub downloads, according to the available data) and Abstracts Views on Vision4Press platform.
Data correspond to usage on the plateform after 2015. The current usage metrics is available 48-96 hours after online publication and is updated daily on week days.
Initial download of the metrics may take a while.