Fig. 5.
Download original image
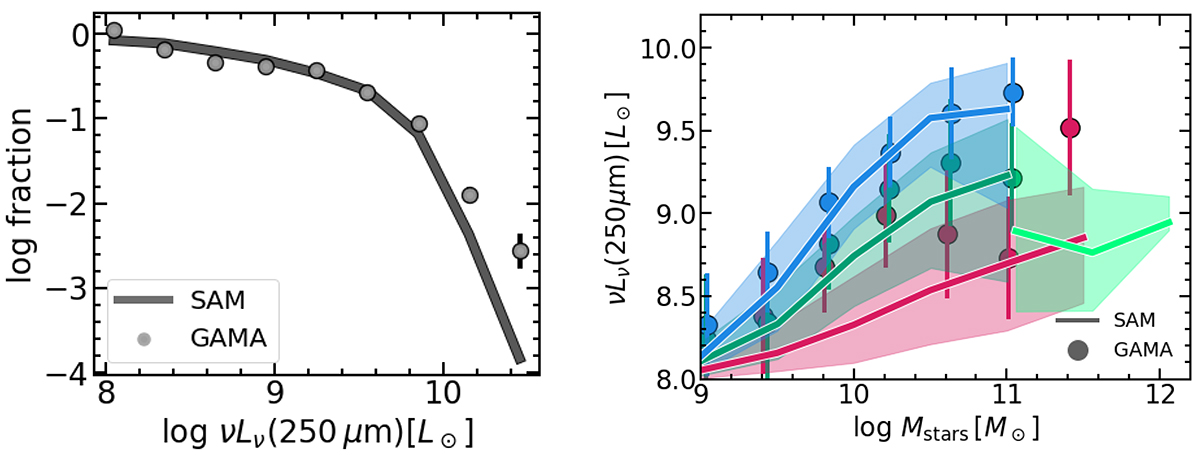
Comparison between the simulated (solid lines) and GAMA (filled circles) sample in terms of 250 μm luminosity. Left panel: νLν (250 μm) distribution of the two samples. Right panel: Mstars − νLν (250 μm) relation for the two samples split according to the classification outlined in Sect. 5 (blue for BC, green for GV, red for RS, and light green for no-RS objects). Solid lines and filled circles are median values, while the error bars and shaded regions refer to the 16 − 84th percentiles.
Current usage metrics show cumulative count of Article Views (full-text article views including HTML views, PDF and ePub downloads, according to the available data) and Abstracts Views on Vision4Press platform.
Data correspond to usage on the plateform after 2015. The current usage metrics is available 48-96 hours after online publication and is updated daily on week days.
Initial download of the metrics may take a while.