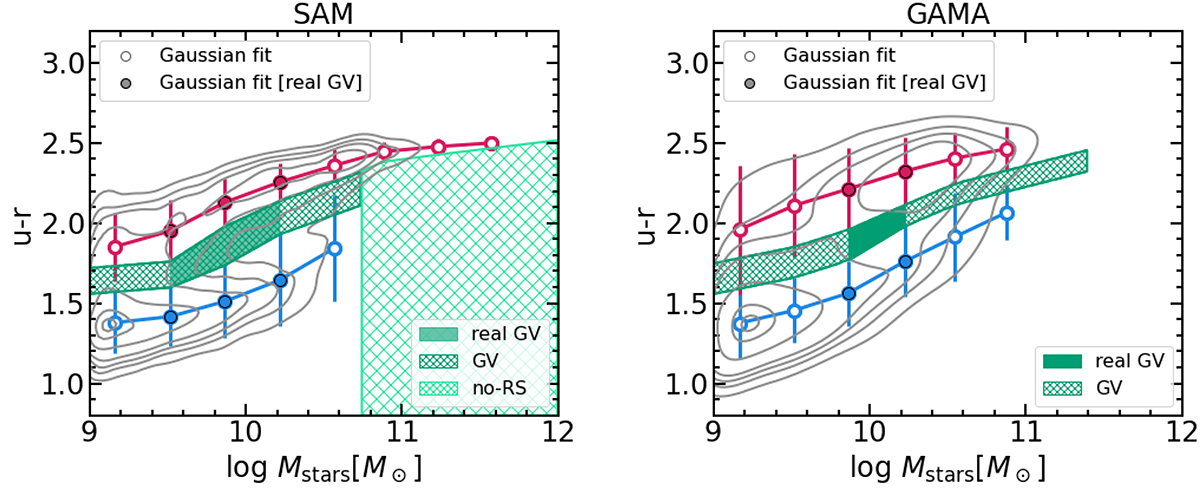
Fig. 3.
Download original image
GV identification in the colour–mass diagram of both our simulated and observed samples at z ≤ 0.08. The distribution of galaxies is shown as contours marking the 1, 5, 20, 50, 70, 80, and 90% percentiles of the distribution. The circles and error bars indicate the mean and standard deviation of the Gaussian fits performed by our algorithm in each mass bin for both the blue and red population. Filled circles are associated with bins in which the real GV can be identified (according to Eq. (4)). This region is depicted in solid green in the plots. The green hatched region represents an extension of this GV, obtained by using information from the Gaussian fits. The light green hatched region in the SAM sample marks the region of the diagram where galaxies are identified as not belonging to the RS, since a single-Gaussian fit is favoured in these mass bins. In the GAMA sample, the GV has been linearly extrapolated in the high stellar mass range, where the number of galaxies per bin was not sufficient to perform a double-Gaussian fit (< 50 galaxies).
Current usage metrics show cumulative count of Article Views (full-text article views including HTML views, PDF and ePub downloads, according to the available data) and Abstracts Views on Vision4Press platform.
Data correspond to usage on the plateform after 2015. The current usage metrics is available 48-96 hours after online publication and is updated daily on week days.
Initial download of the metrics may take a while.