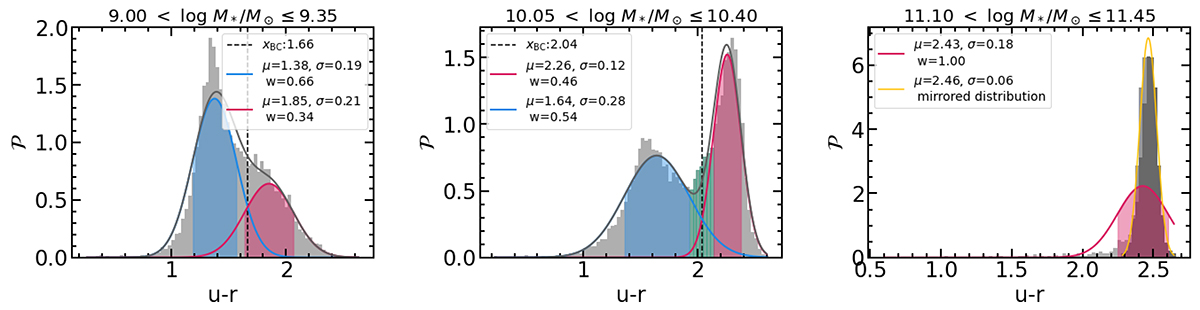
Fig. 2.
Download original image
Examples of Gaussian-fit-based algorithms used to identify blue and red populations across different mass bins. The three cases illustrate the colour distribution of our simulated sample at z ≤ 0.08 in three different mass bins, offering a clear demonstration of how our algorithm works (see the main text for full details). The full colour distribution of galaxies in each bin is shown as a grey histogram and the Gaussian fits as curves, with the shaded regions indicating the standard deviation and the dashed line the intersection between the two curves (where present). The parameters for each Gaussian (mean, μ, standard deviation, σ, and weight, w) are labelled in every panel. In the left and middle panels, our algorithm favours a double Gaussian distribution (blue and red, with the grey line indicating their sum). However, a real GV (green histogram) is identified only in the middle panel, since here the condition in Eq. (4) is met. In the right panel, the algorithm prefers a single Gaussian fit, which is shown as a red curve. In this case, a subsample of the total is extracted to obtain a symmetric distribution centred around the peak of the original. This sub-distribution, represented by the dark grey histogram, is fitted by the yellow Gaussian curve. The parameters from this fit better represent the red population in this mass bin and are used in our analysis.
Current usage metrics show cumulative count of Article Views (full-text article views including HTML views, PDF and ePub downloads, according to the available data) and Abstracts Views on Vision4Press platform.
Data correspond to usage on the plateform after 2015. The current usage metrics is available 48-96 hours after online publication and is updated daily on week days.
Initial download of the metrics may take a while.