Fig. 7.
Download original image
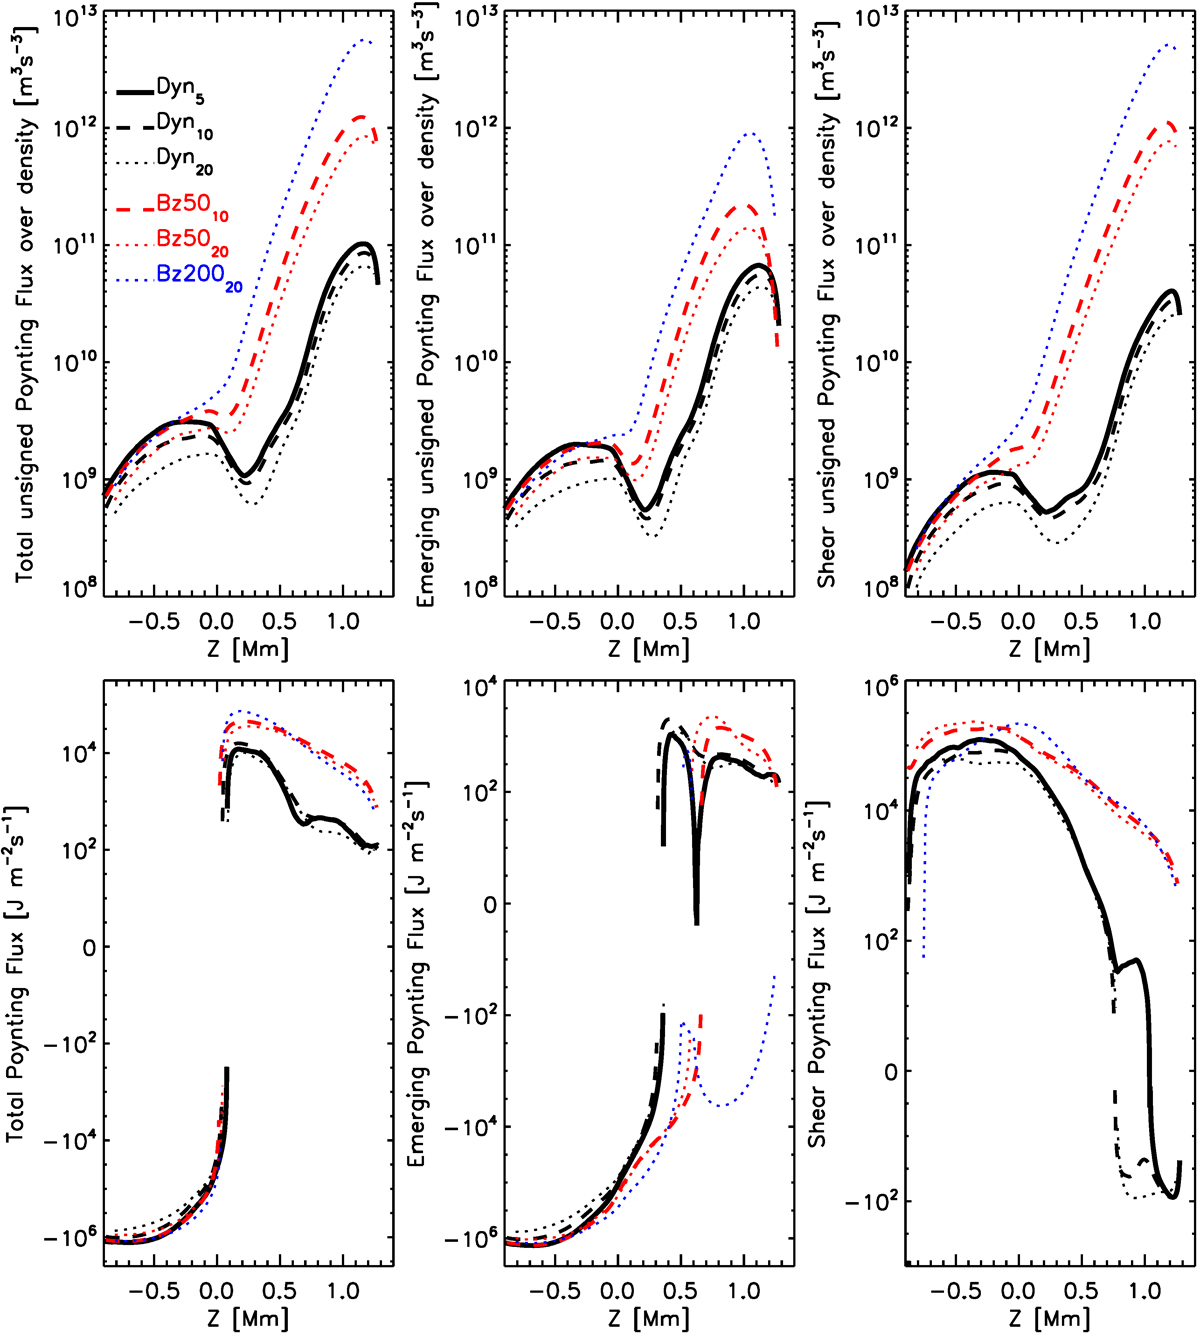
Upper panels, left: Horizontal and temporal average of the unsigned vertical component of the magnetic Poynting flux in different runs as a function of height. For better visualization, the Poynting flux has been normalized over the density. Middle: Emerging Poynting flux, vertical component, computed as ![]() . Right: Shear Poynting flux, vertical component, computed as
. Right: Shear Poynting flux, vertical component, computed as ![]() . Black lines are for the Dyn model, red for the Bz50 model, and blue for the Bz200 model. The solid thick line is for 5 km resolution, the dashed medium-thick line is for 10 km resolution, and the dotted thin line is for 20 km resolution. Bottom panels represent the same but without dividing by density and taking into account the sign while averaging. Negative values mean downward propagating flux. The apparent discontinuity in the curves is due to representation, which is caused by the change of sign.
. Black lines are for the Dyn model, red for the Bz50 model, and blue for the Bz200 model. The solid thick line is for 5 km resolution, the dashed medium-thick line is for 10 km resolution, and the dotted thin line is for 20 km resolution. Bottom panels represent the same but without dividing by density and taking into account the sign while averaging. Negative values mean downward propagating flux. The apparent discontinuity in the curves is due to representation, which is caused by the change of sign.
Current usage metrics show cumulative count of Article Views (full-text article views including HTML views, PDF and ePub downloads, according to the available data) and Abstracts Views on Vision4Press platform.
Data correspond to usage on the plateform after 2015. The current usage metrics is available 48-96 hours after online publication and is updated daily on week days.
Initial download of the metrics may take a while.