Fig. 6.
Download original image
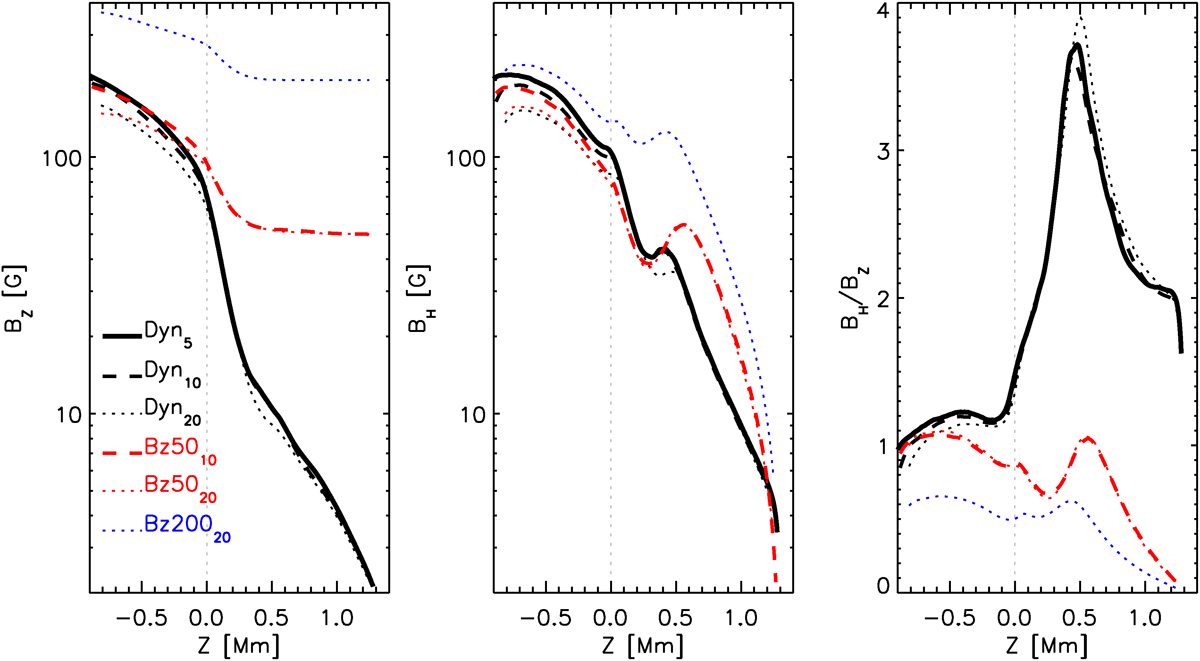
Horizontally and temporally averaged magnetic field components in the different runs as a function of height. Left: Vertical component, 〈|BZ|〉. Middle: Horizontal component, ![]() . Right: Ratio between the horizontal and the vertical components. Black lines are for Dyn model, red for the Bz50 model. and blue for the Bz200 model. The solid thick line is for 5 km resolution, the dashed medium-thick line is for 10 km resolution, and the dotted thin line is for 20 km resolution.
. Right: Ratio between the horizontal and the vertical components. Black lines are for Dyn model, red for the Bz50 model. and blue for the Bz200 model. The solid thick line is for 5 km resolution, the dashed medium-thick line is for 10 km resolution, and the dotted thin line is for 20 km resolution.
Current usage metrics show cumulative count of Article Views (full-text article views including HTML views, PDF and ePub downloads, according to the available data) and Abstracts Views on Vision4Press platform.
Data correspond to usage on the plateform after 2015. The current usage metrics is available 48-96 hours after online publication and is updated daily on week days.
Initial download of the metrics may take a while.