Fig. 2.
Download original image
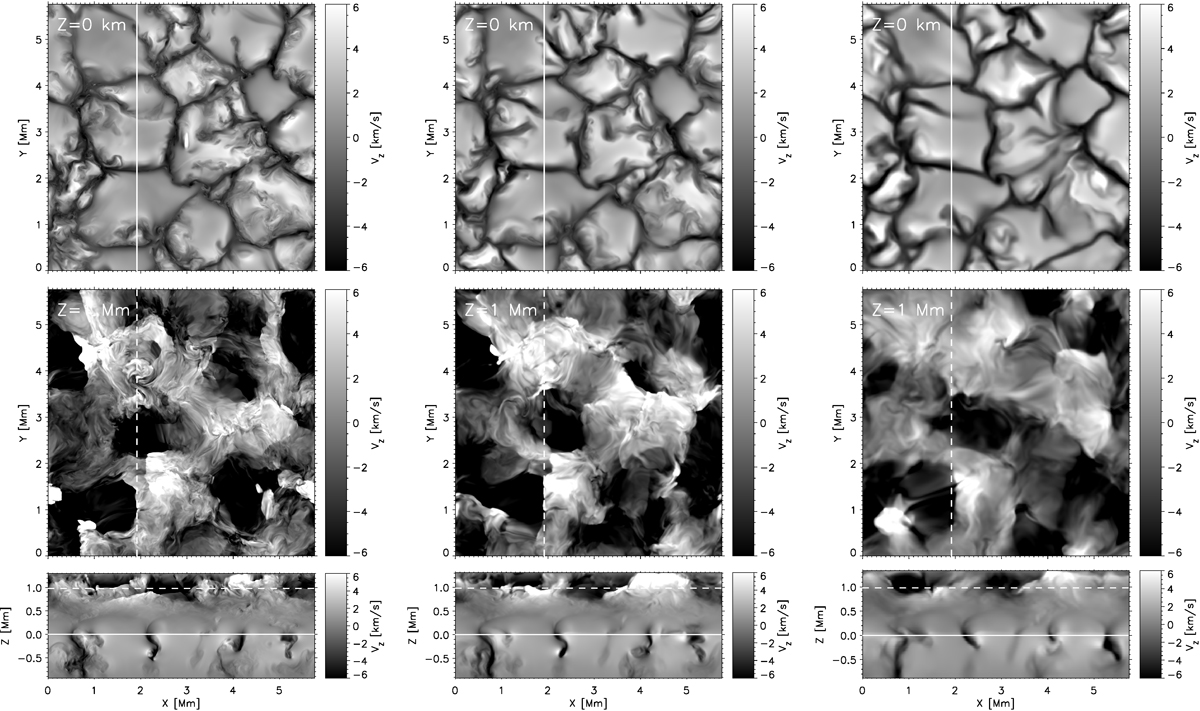
Snapshots of the vertical velocities in the photosphere at z = 0 km (top row), in the chromosphere at z = 1 Mm (middle row), and in a vertical cut at an arbitrary horizontal location (bottom row). Vertical lines at the top and middle panels mark the location of the slice from the bottom panel. Horizontal lines at the bottom panels mark the heights where the velocities at the upper panels are shown. Panels from left to right are for Dyn5, Dyn10, and Dyn20 simulations, correspondingly.
Current usage metrics show cumulative count of Article Views (full-text article views including HTML views, PDF and ePub downloads, according to the available data) and Abstracts Views on Vision4Press platform.
Data correspond to usage on the plateform after 2015. The current usage metrics is available 48-96 hours after online publication and is updated daily on week days.
Initial download of the metrics may take a while.