Fig. 15.
Download original image
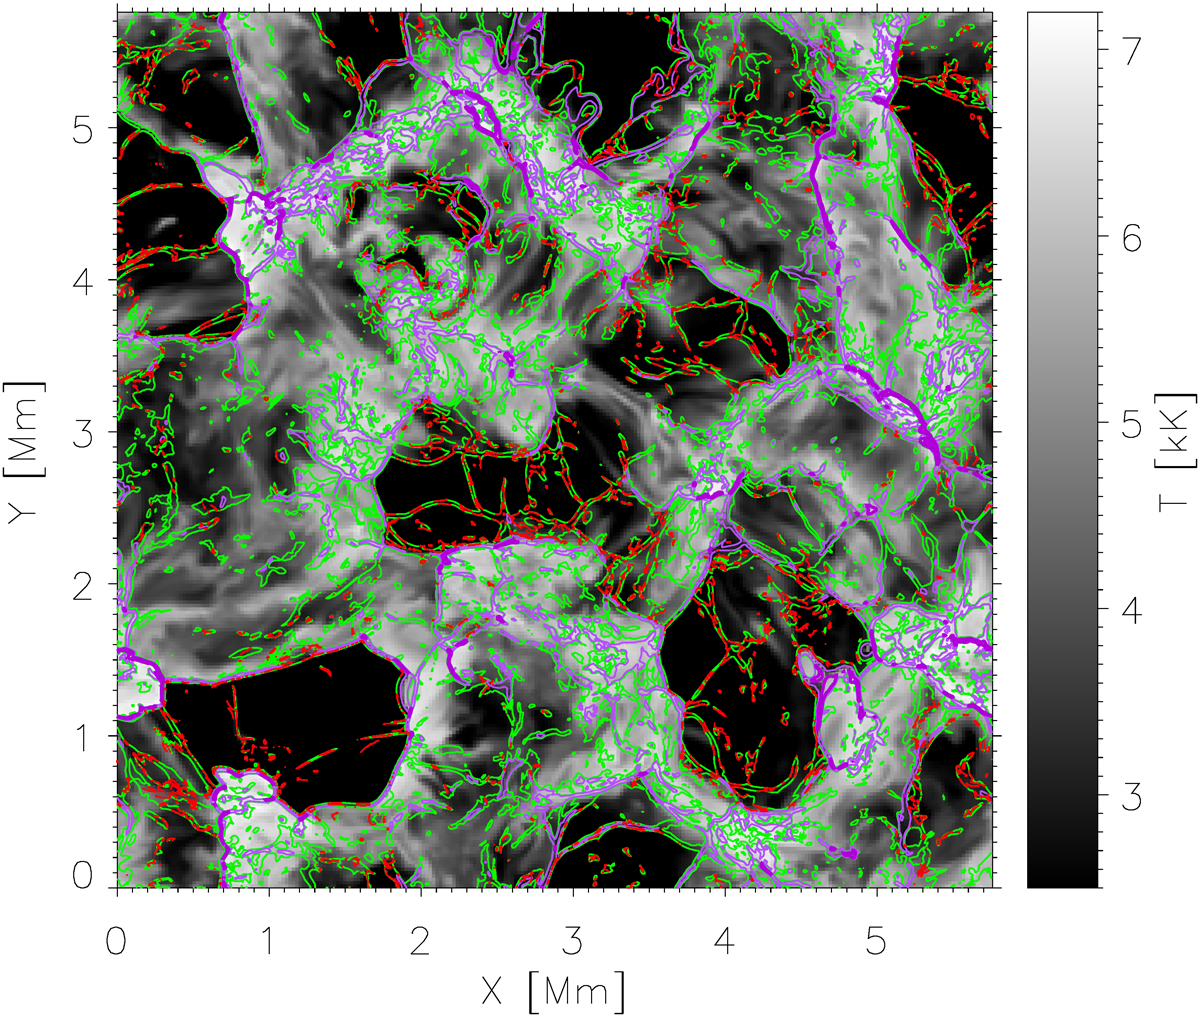
Spatial variation of temperature at 1 Mm height in the Dyn5 model (gray color) together with iso-contours of compressional heating QCOMP = 0.001 (green), 0.1 (light violet), and 1 (dark violet) J m−3 s−1, where a larger number means a larger compression. Red colors show the iso-contours of a mask where two conditions together are fulfilled: QAMB>Qscheme and QCOMP>0.
Current usage metrics show cumulative count of Article Views (full-text article views including HTML views, PDF and ePub downloads, according to the available data) and Abstracts Views on Vision4Press platform.
Data correspond to usage on the plateform after 2015. The current usage metrics is available 48-96 hours after online publication and is updated daily on week days.
Initial download of the metrics may take a while.