Fig. 13.
Download original image
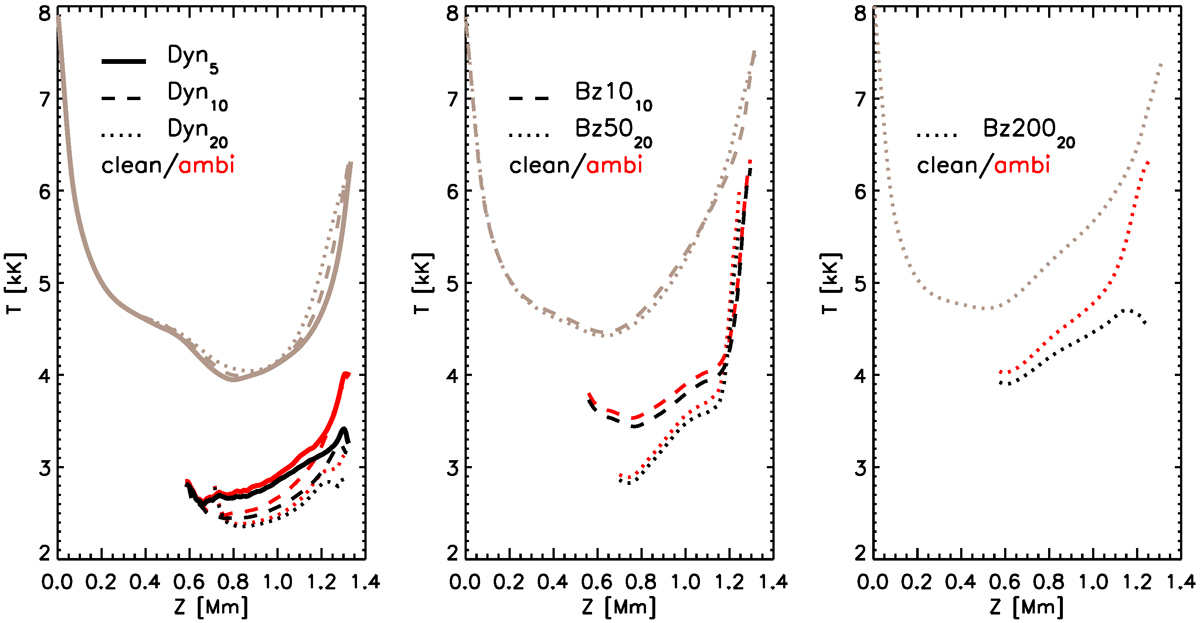
Height dependence of the average temperature (light brown curves extending over all height range) together with the average temperature at locations with ![]() in the “clean” runs (black) and in the “ambi” runs (red). Panels (from left to right) are for the Dyn, Bz50, and Bz200 models. The averaging was performed for the times from 200 s until 1200 s for Dyn20, Dyn10, and Bz5020 and from 200 s until the maximum available time in the rest of the cases.
in the “clean” runs (black) and in the “ambi” runs (red). Panels (from left to right) are for the Dyn, Bz50, and Bz200 models. The averaging was performed for the times from 200 s until 1200 s for Dyn20, Dyn10, and Bz5020 and from 200 s until the maximum available time in the rest of the cases.
Current usage metrics show cumulative count of Article Views (full-text article views including HTML views, PDF and ePub downloads, according to the available data) and Abstracts Views on Vision4Press platform.
Data correspond to usage on the plateform after 2015. The current usage metrics is available 48-96 hours after online publication and is updated daily on week days.
Initial download of the metrics may take a while.