Fig. 12.
Download original image
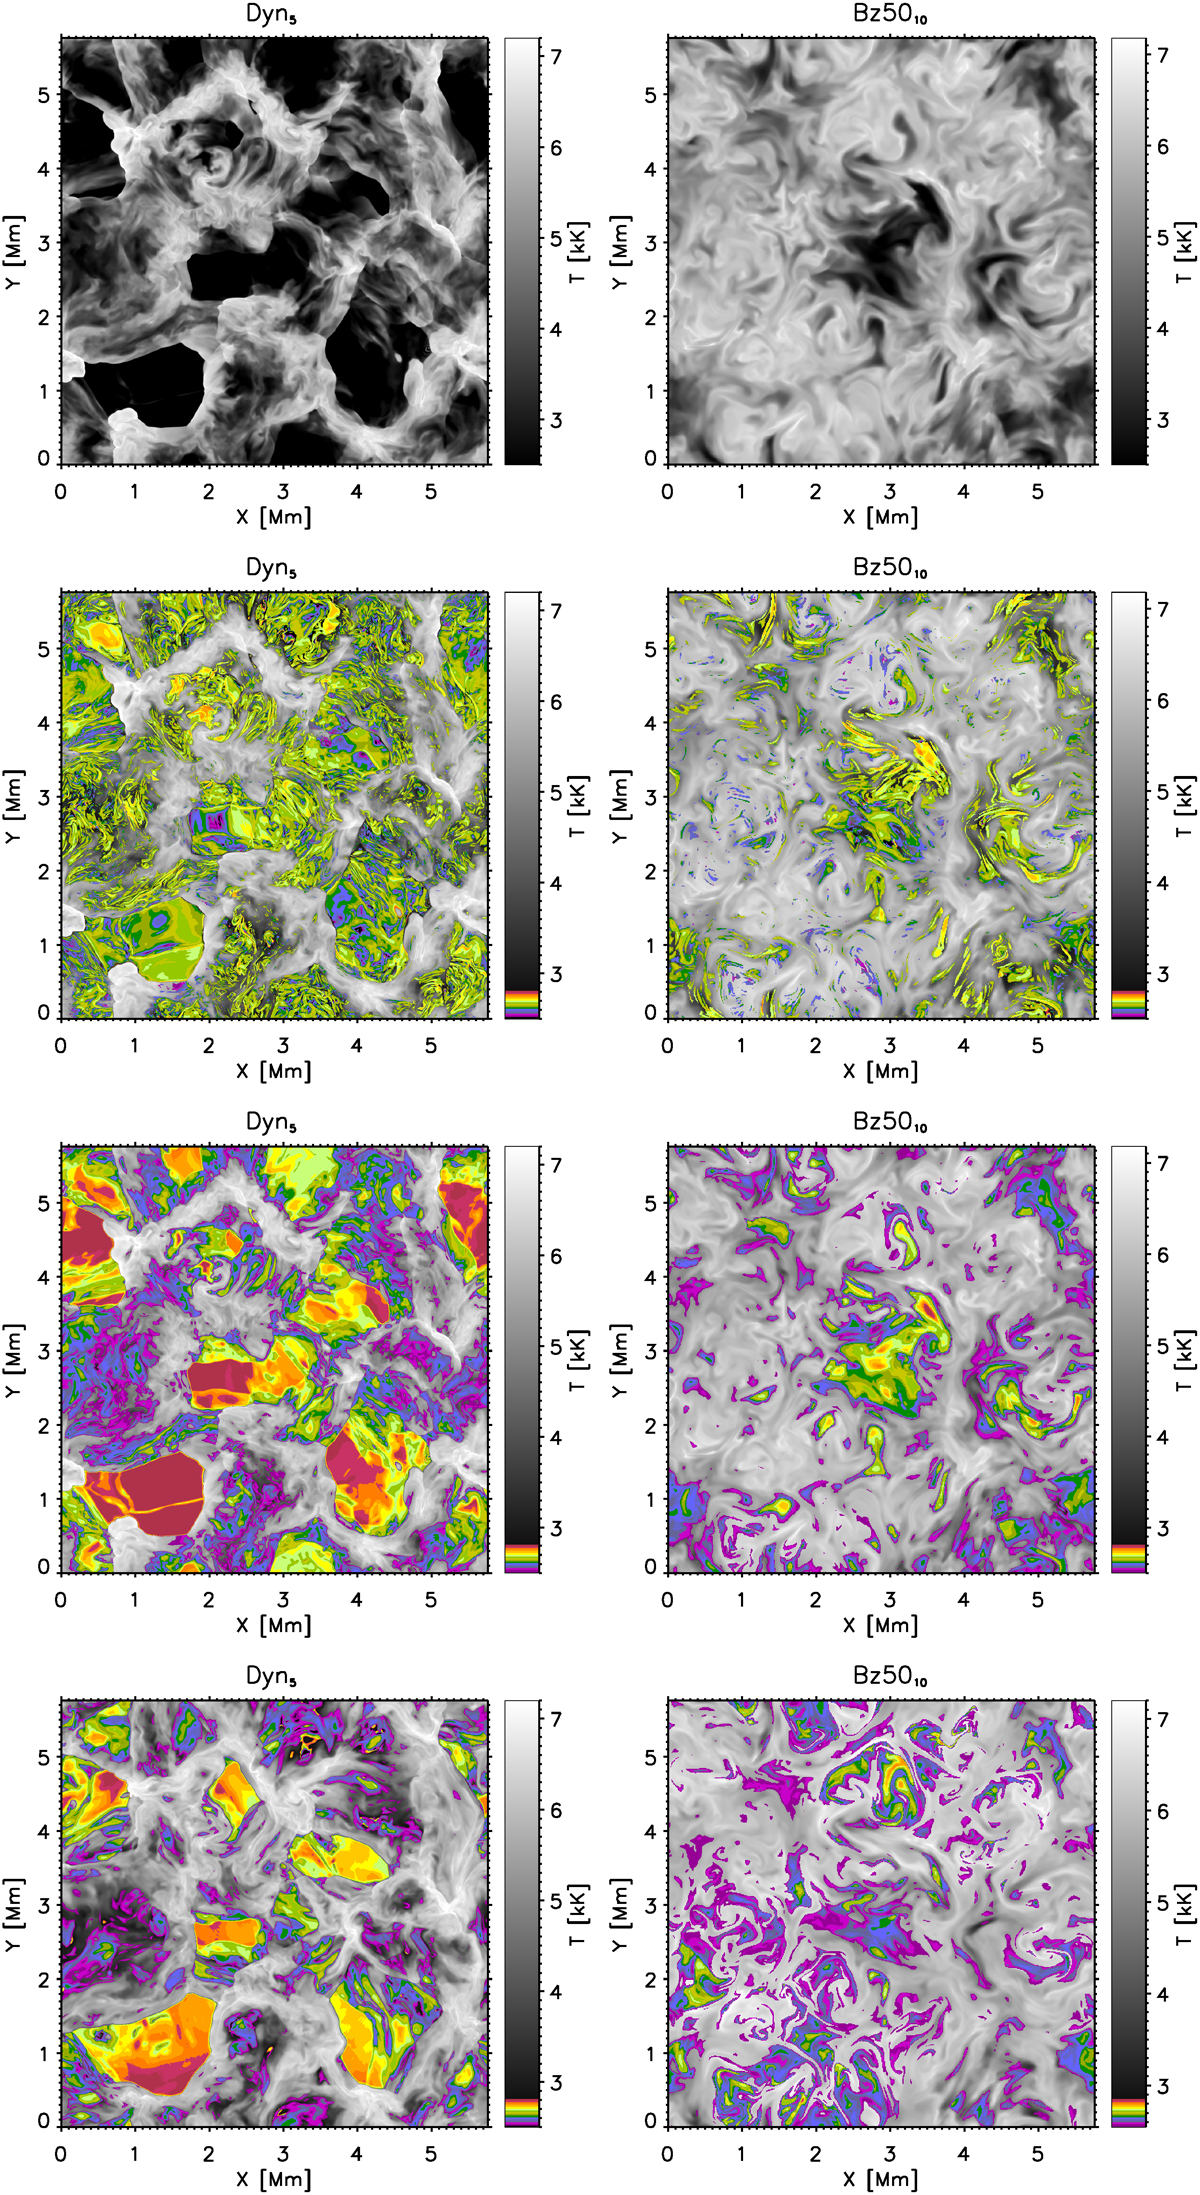
First row: Snapshot of temperature at z = 1 Mm in the Dyn5 (left) and in the Bz5010 models (right) for comparison purposes. Second row: Locations with the largest QAMB from QAMB = 10−6 J m−3 s−1 (violet color) to QAMB = 10−1 J m−3 s−1 (vermilion color) plotted over the temperature image (in gray) only at locations with the condition QAMB>0.1*Qscheme fulfilled. Third row: Same as the second row, except that colored areas indicate locations with the largest LA/Δz in logarithmic scale in a range from 0.01 (violet color) to 10 (vermilion color) at locations with the condition LA/Δz>0.01 fulfilled. Fourth row: Same as the second row, except that the colored areas indicate locations with ![]() with ηA in the range from 106 to 109 m2 s−1.
with ηA in the range from 106 to 109 m2 s−1.
Current usage metrics show cumulative count of Article Views (full-text article views including HTML views, PDF and ePub downloads, according to the available data) and Abstracts Views on Vision4Press platform.
Data correspond to usage on the plateform after 2015. The current usage metrics is available 48-96 hours after online publication and is updated daily on week days.
Initial download of the metrics may take a while.