Open Access
Fig. 1.
Download original image
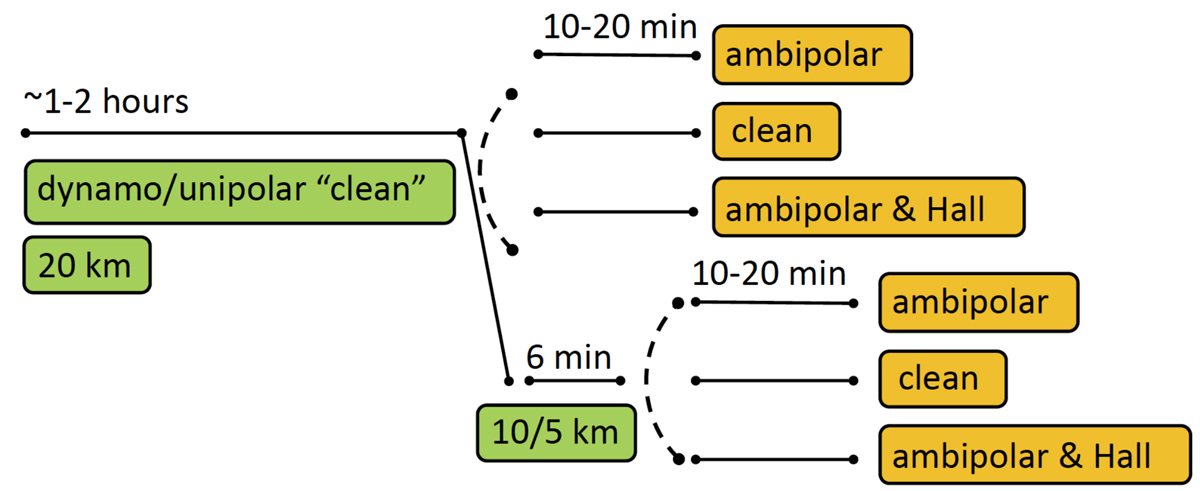
Simulation setup. Green labels indicate time spans where the simulations were run to either reach the stationary state or settle the refined resolution. The yellow labels indicate the time spans where the snapshots were saved for the analysis every 10 s.
Current usage metrics show cumulative count of Article Views (full-text article views including HTML views, PDF and ePub downloads, according to the available data) and Abstracts Views on Vision4Press platform.
Data correspond to usage on the plateform after 2015. The current usage metrics is available 48-96 hours after online publication and is updated daily on week days.
Initial download of the metrics may take a while.