Open Access
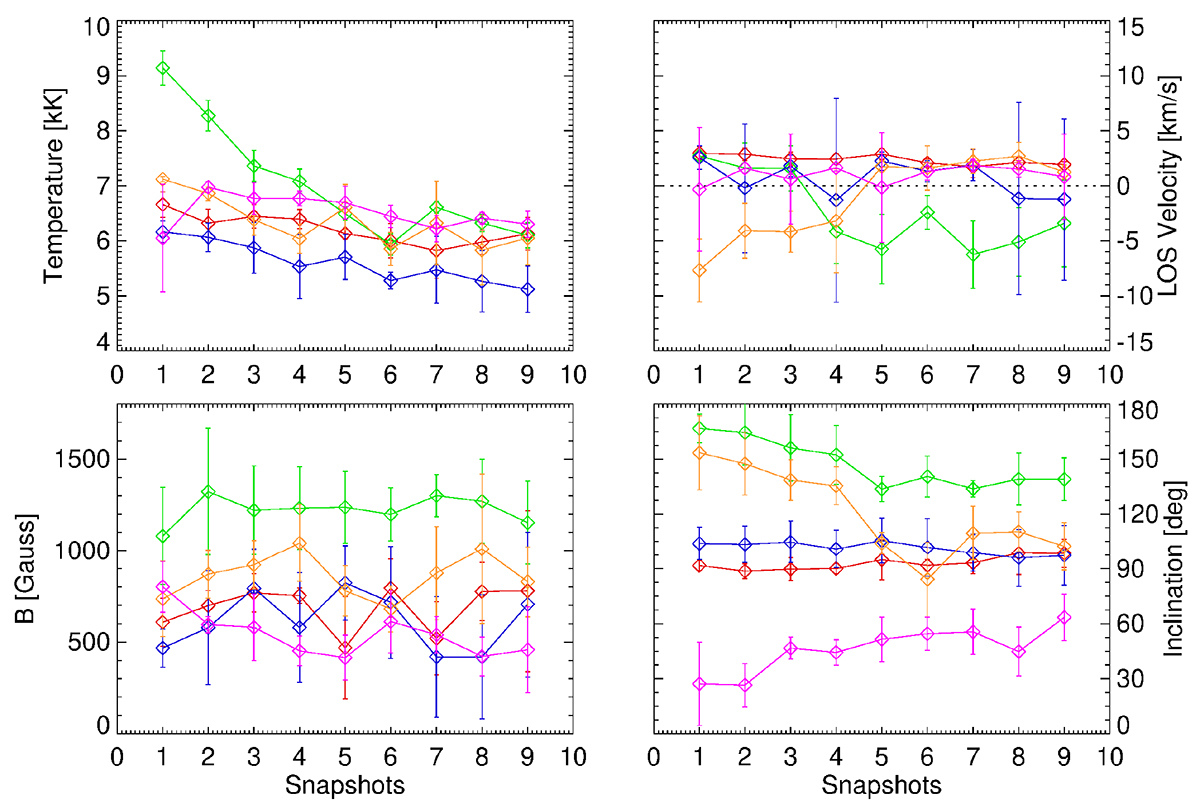
Fig. 9.
Download original image
Evolution of the atmospheric parameters belonging to the areas highlighted with colour in Figure 5. The top row, from left to right, shows the evolution of the temperature and LOS velocity, while the bottom row, from left to right, shows the evolution of the magnetic field strength and inclination.
Current usage metrics show cumulative count of Article Views (full-text article views including HTML views, PDF and ePub downloads, according to the available data) and Abstracts Views on Vision4Press platform.
Data correspond to usage on the plateform after 2015. The current usage metrics is available 48-96 hours after online publication and is updated daily on week days.
Initial download of the metrics may take a while.