Open Access
Fig. 2.
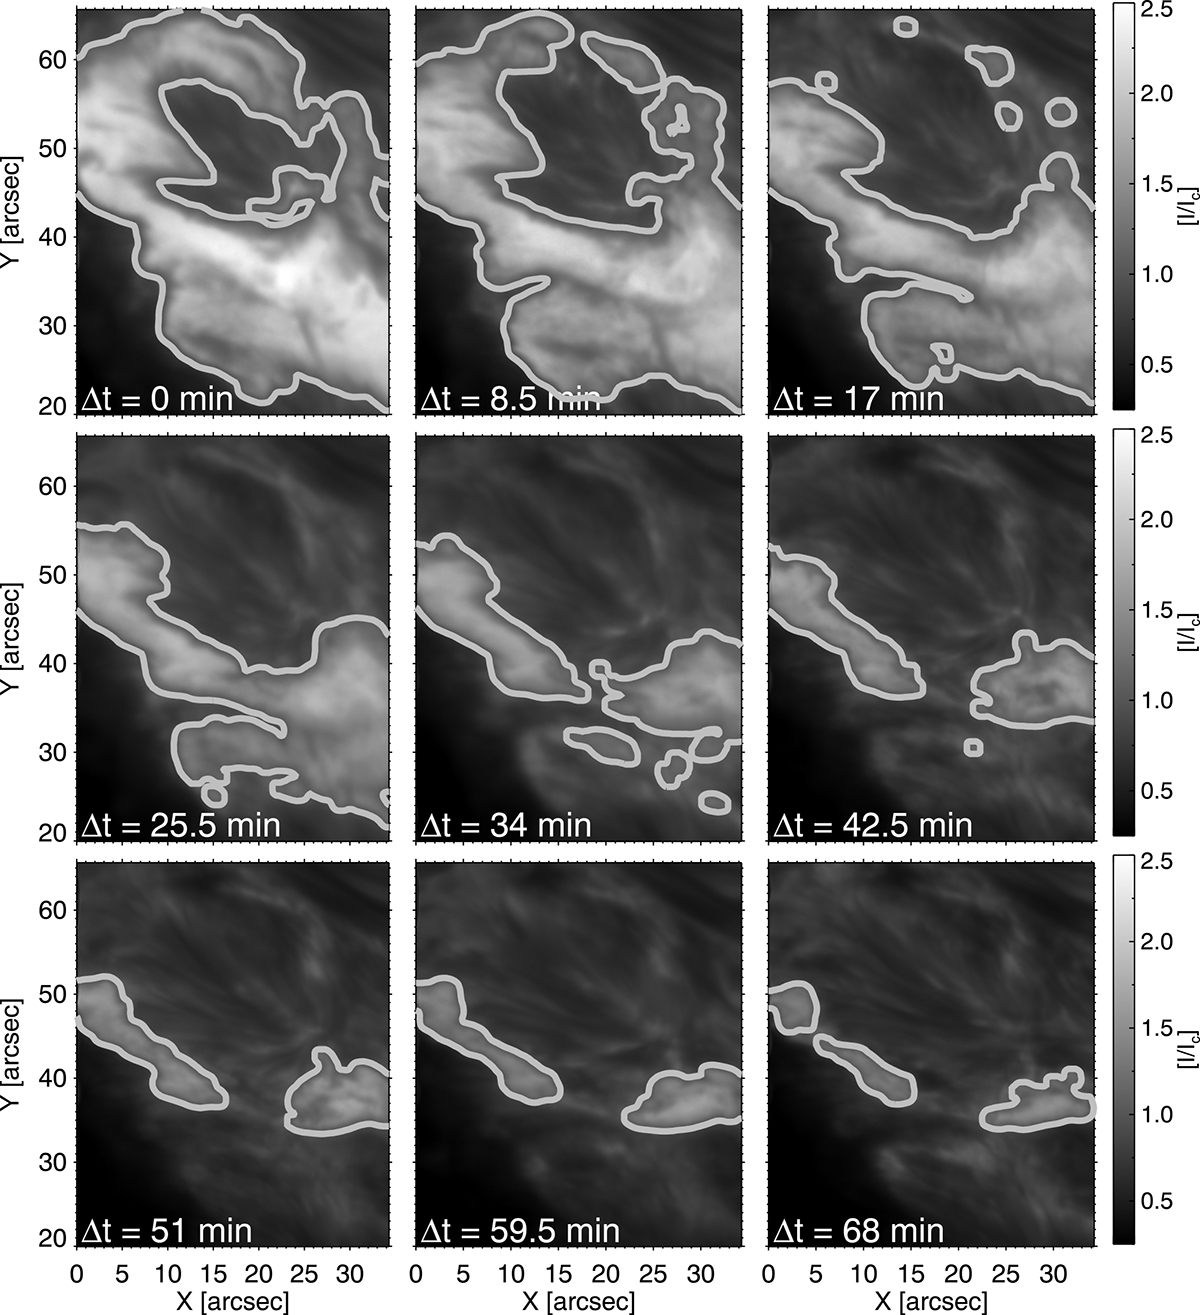
Download original image
Evolution of the spatial distribution of the line core intensity signals for the Ca II spectral line. The time difference between panels is around 10 min. Contours designate the areas where the line core intensity of the Ca II transition is equal to or higher than 1.1 of the Ic for each snapshot.
Current usage metrics show cumulative count of Article Views (full-text article views including HTML views, PDF and ePub downloads, according to the available data) and Abstracts Views on Vision4Press platform.
Data correspond to usage on the plateform after 2015. The current usage metrics is available 48-96 hours after online publication and is updated daily on week days.
Initial download of the metrics may take a while.