Open Access
Fig. 3
Download original image
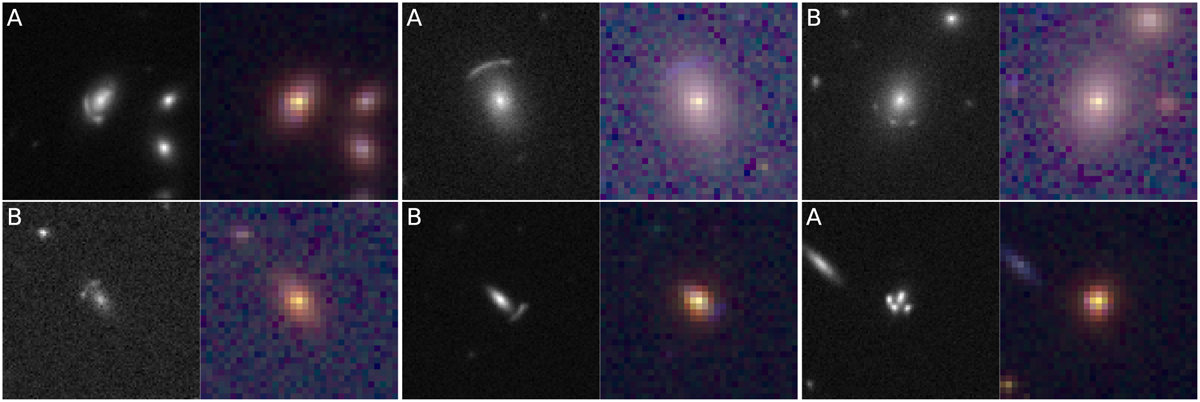
Six simulated lenses as seen in the visualisation tools. The left side of each panel corresponds to the high-resolution IE band data, and the right to the HE YE IE composite image. The letter at the upper-left corner of each panel corresponds to the final joint grade given in the visual inspection.
Current usage metrics show cumulative count of Article Views (full-text article views including HTML views, PDF and ePub downloads, according to the available data) and Abstracts Views on Vision4Press platform.
Data correspond to usage on the plateform after 2015. The current usage metrics is available 48-96 hours after online publication and is updated daily on week days.
Initial download of the metrics may take a while.