Fig. 2
Download original image
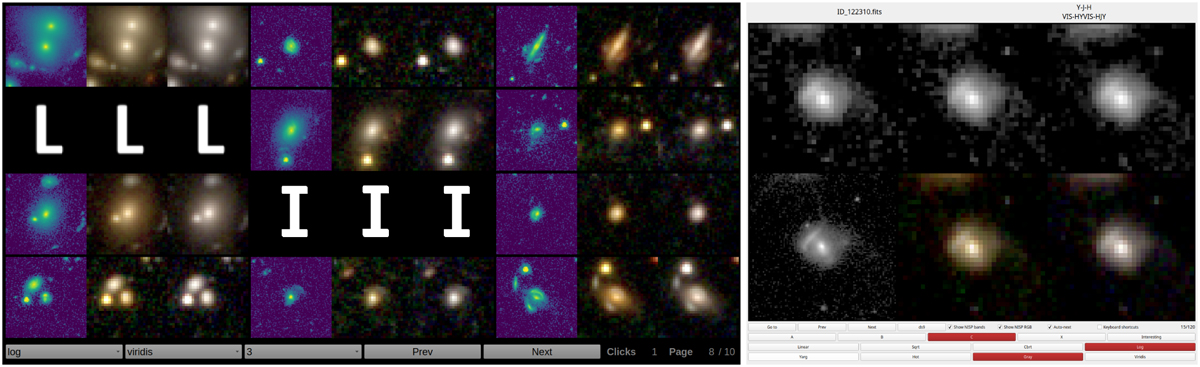
Visualisation tools used for the visual inspection. Left panel: mosaic tool showing 12 sources in a 3 × 4 rectangular grid. The first object of the second row is marked as a lens candidate, whereas the second object of the third row is marked as interesting. Right panel: one-by-one sequential tool showing an object graded as C. Both tools show a monochromatic high-resolution IE band image, an HE YE IE RGB composite image, and a HE JE YE RGB composite image (in the second row for the one-by-one sequential tool). Both RGB composite images are at the NISP resolution. The one-by-one sequential tool also shows, in its first row, the three NISP bands: YE, JE, and HE. Users are only required to inspect the high-resolution IE monochromatic image and the HE YE IE composite image.
Current usage metrics show cumulative count of Article Views (full-text article views including HTML views, PDF and ePub downloads, according to the available data) and Abstracts Views on Vision4Press platform.
Data correspond to usage on the plateform after 2015. The current usage metrics is available 48-96 hours after online publication and is updated daily on week days.
Initial download of the metrics may take a while.