Fig. 10
Download original image
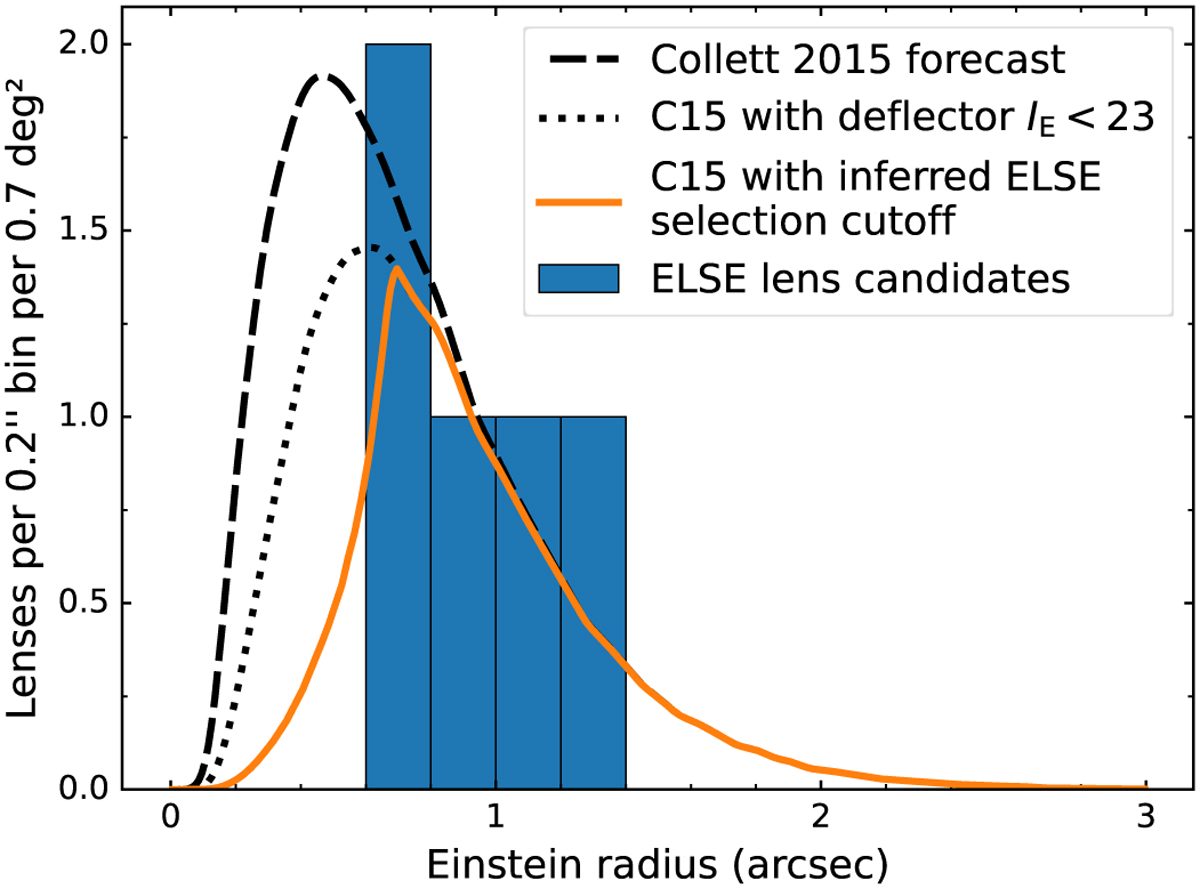
Comparison of the number of lenses and their Einstein radius distribution of successfully modelled ELSE candidates (blue histogram), and the forecasts of Collett (2015) rescaled to 0.7 deg2 (dotted black line). The dotted black line is a prediction, not a fit. The orange ‘cutoff’ line is a modification of the Collett (2015) forecasts to account for the selection function arising from our methodology missing small-Einstein-radius lenses.
Current usage metrics show cumulative count of Article Views (full-text article views including HTML views, PDF and ePub downloads, according to the available data) and Abstracts Views on Vision4Press platform.
Data correspond to usage on the plateform after 2015. The current usage metrics is available 48-96 hours after online publication and is updated daily on week days.
Initial download of the metrics may take a while.