Open Access
Fig. 1
Download original image
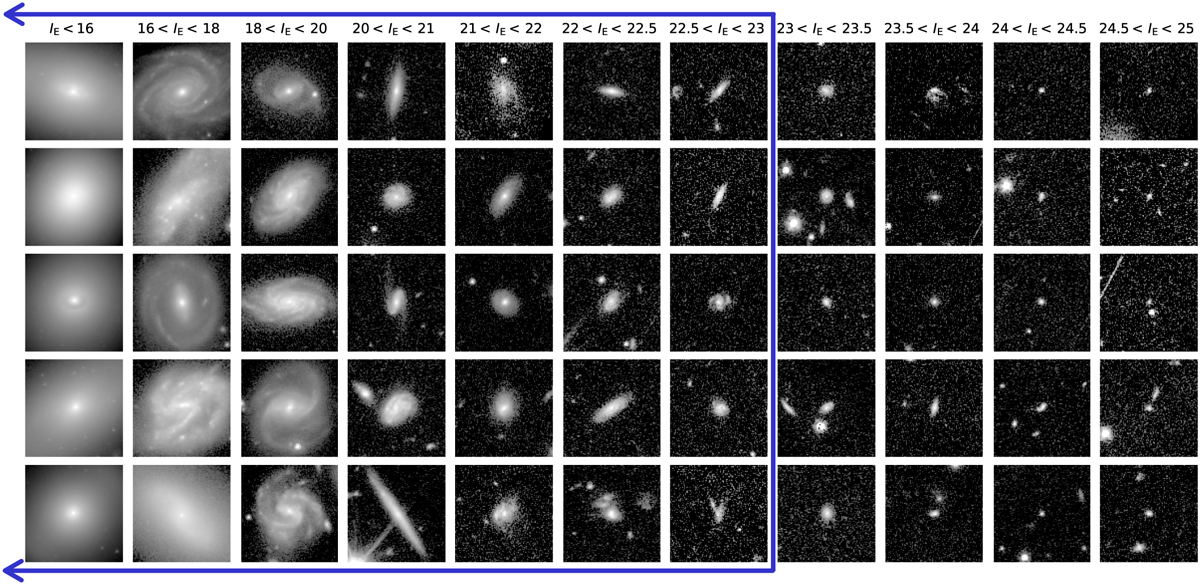
9″.9 × 9″..9 VIS cutouts of galaxies randomly selected across different IE bins, ranging from the brightest galaxies with IE < 16 (leftmost) down to very faint systems with 24.5 < IE < 25 (rightmost). The blue arrow represents the magnitude cut used to select our parent sample.
Current usage metrics show cumulative count of Article Views (full-text article views including HTML views, PDF and ePub downloads, according to the available data) and Abstracts Views on Vision4Press platform.
Data correspond to usage on the plateform after 2015. The current usage metrics is available 48-96 hours after online publication and is updated daily on week days.
Initial download of the metrics may take a while.