Fig. 9
Download original image
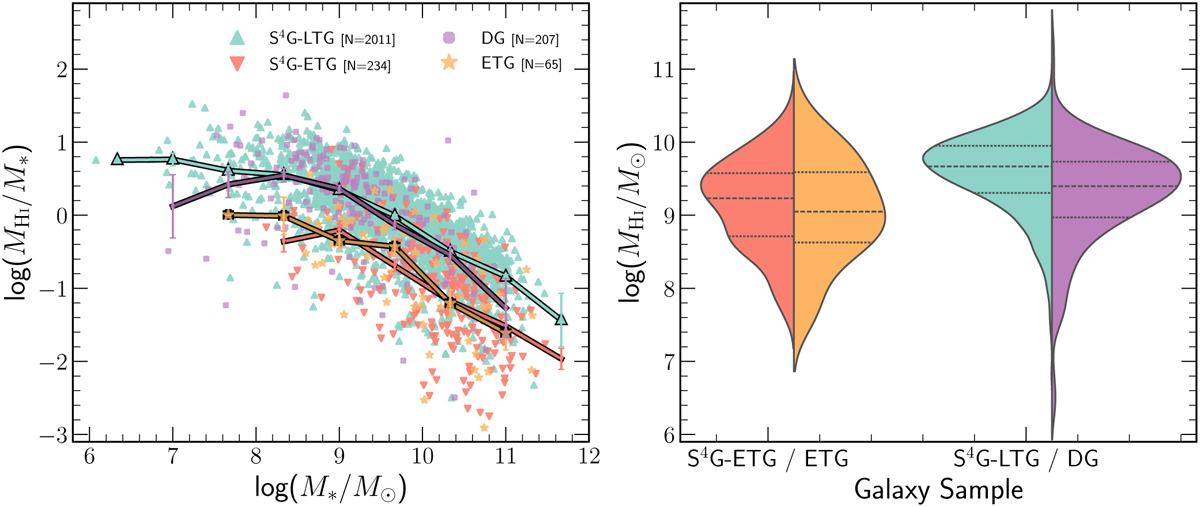
H I mass content distribution. The left panel shows the logarithmic gas fraction, log(MH I /M⋆), versus the stellar mass log(M⋆/M⊙). The right column shows a violin plot of the H I mass relative distributions for all the sub-samples. The x-axis shows the relative distribution of all sub-samples. The lines show the median values (dashed) and the 25% and 75% percentiles (dotted). The S4G-LTG, S4G-ETG, ETG, and DG sub-samples are shown with blue triangles, down-pointing red triangles, orange stars, and purple circles, respectively. The numbers shown in the legend of the left panel indicate the number of galaxies with H I measurements in each sub-sample.
Current usage metrics show cumulative count of Article Views (full-text article views including HTML views, PDF and ePub downloads, according to the available data) and Abstracts Views on Vision4Press platform.
Data correspond to usage on the plateform after 2015. The current usage metrics is available 48-96 hours after online publication and is updated daily on week days.
Initial download of the metrics may take a while.