Fig. 8
Download original image
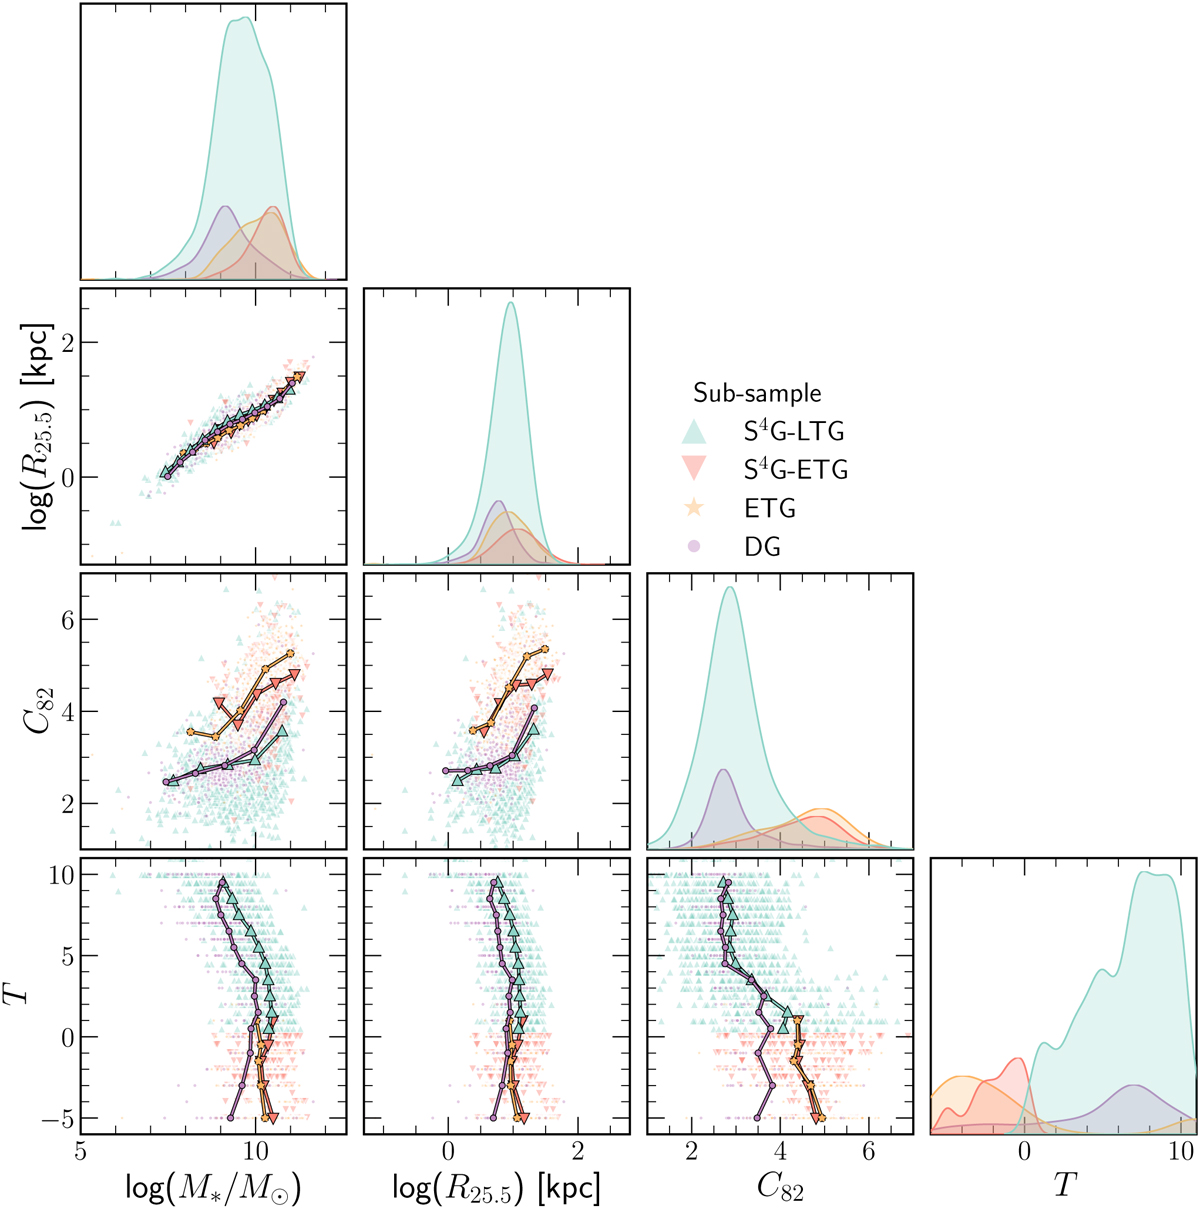
Corner plot of the parameter space described by some of the photometric parameters derived for the DG sample together with the original sample and ETG extension. From top-left to bottom-right, the diagonal of the figure shows the absolute distribution of the stellar mass, log(M⋆/M⊙), the galaxy size measured by the isophotal radii at 25.5 mag arcsec−2, log(R25.5), the concentration index, C82, and the morphological types, T , for the different samples, the original S4G-LTGs (blue triangles) and S4G-ETGs (down-pointing red triangles), the ETG extension (orange stars), and the DG extension (purple circles). These distributions are heavily smoothed. Each column and row represents one of the parameters. The first column (left) shows, from top to bottom, galaxy size, concentration index and morphological type versus stellar mass. The second column shows the concentration index and morphological type versus galaxy size. The last column shows morphological types versus concentration index. Curves represent the average values within mass bins for the middle two rows and within morphological types bins for the last row.
Current usage metrics show cumulative count of Article Views (full-text article views including HTML views, PDF and ePub downloads, according to the available data) and Abstracts Views on Vision4Press platform.
Data correspond to usage on the plateform after 2015. The current usage metrics is available 48-96 hours after online publication and is updated daily on week days.
Initial download of the metrics may take a while.