Fig. 7
Download original image
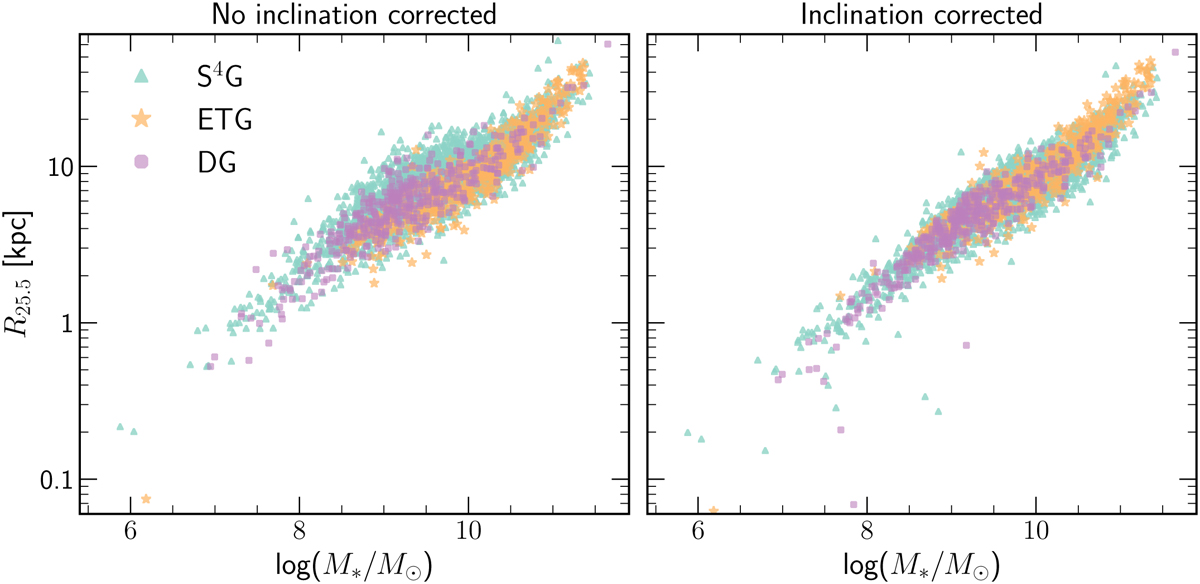
Stellar mass–size relation showing the correlation of size, traced by the isophotal radius (R25.5) with the stellar mass. The DG, ETG, and original S4G samples are represented with purple circles, orange stars, and blue triangles respectively. The isophotal radius axis is on a logarithmic scale. The left panel shows the size of galaxies with no correction, and the left panel shows the size of galaxies with inclination correction.
Current usage metrics show cumulative count of Article Views (full-text article views including HTML views, PDF and ePub downloads, according to the available data) and Abstracts Views on Vision4Press platform.
Data correspond to usage on the plateform after 2015. The current usage metrics is available 48-96 hours after online publication and is updated daily on week days.
Initial download of the metrics may take a while.