Fig. 6
Download original image
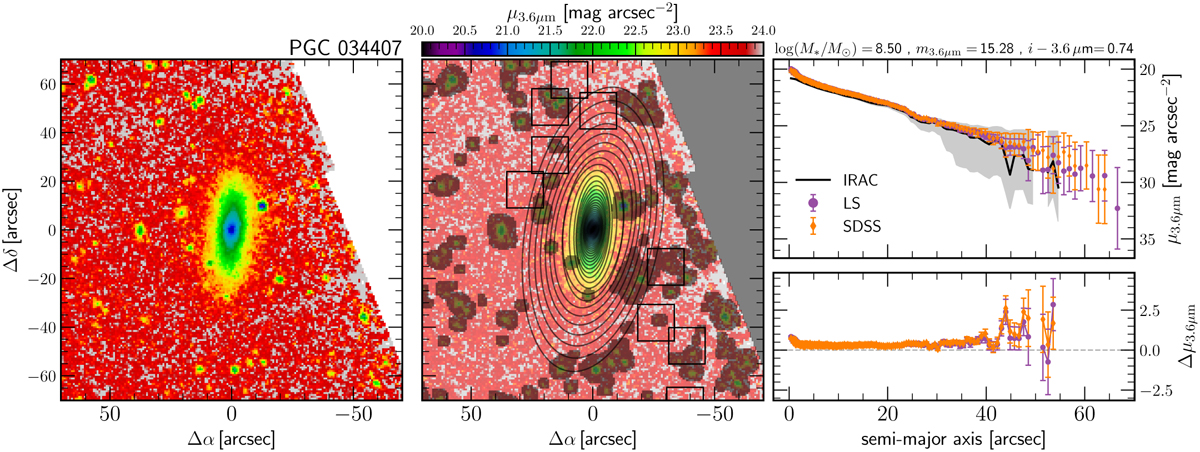
Surface brightness maps and profiles. The left panel shows the surface brightness map of PGC 34407 in the 3.6 μm band. The middle panel shows the surface brightness map overlaid with the mask image with shaded regions, and the elliptical apertures used to measure the radial profile. The top right panel shows the radial surface brightness profile derived using the 3.6 μm band (black curve), the i-band from the Legacy Imaging Surveys (purple circles), and i-band from the SDSS (orange diamonds). The radial profiles of both the i-band images have been converted to 3.6 μm using the recipe described in Sect. 5. The lower right panel shows the difference between the mid-IR profile and the converted optical profiles.
Current usage metrics show cumulative count of Article Views (full-text article views including HTML views, PDF and ePub downloads, according to the available data) and Abstracts Views on Vision4Press platform.
Data correspond to usage on the plateform after 2015. The current usage metrics is available 48-96 hours after online publication and is updated daily on week days.
Initial download of the metrics may take a while.