Fig. 5
Download original image
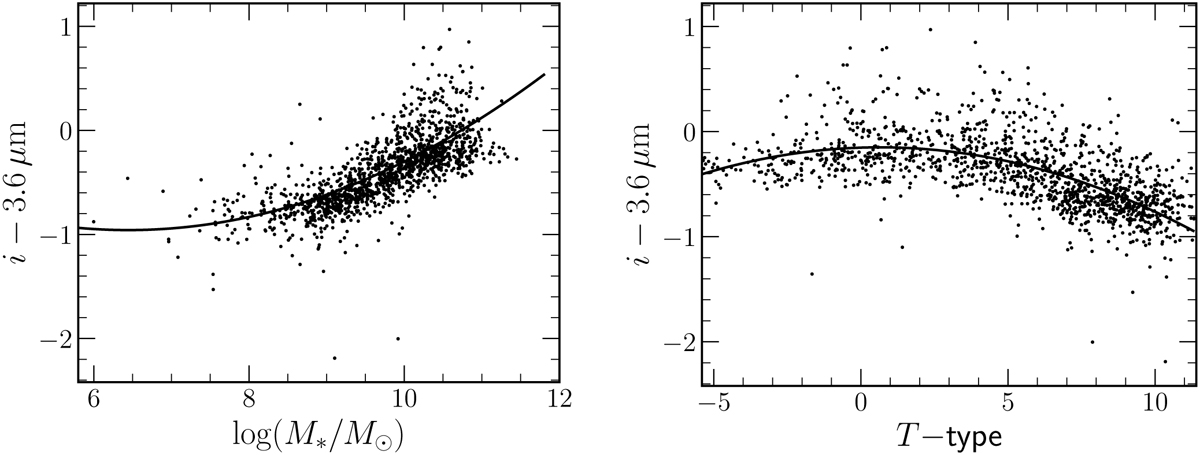
Optical to infrared conversion using galaxies in the original S4G sample. The left panel shows the i − 3.6 μm colour versus the stellar mass relationship. The right panel shows the i − 3.6 μm colour plotted against the CVRHS revised T −types. To have a more homogeneous distribution in the right-hand panel, we added a random offset according to the uncertainties of the morphological revised T-types as reported by Buta et al. (2015), from a normal distribution with a width of their uncertainties, N(0, 0.52).
Current usage metrics show cumulative count of Article Views (full-text article views including HTML views, PDF and ePub downloads, according to the available data) and Abstracts Views on Vision4Press platform.
Data correspond to usage on the plateform after 2015. The current usage metrics is available 48-96 hours after online publication and is updated daily on week days.
Initial download of the metrics may take a while.