Fig. 4
Download original image
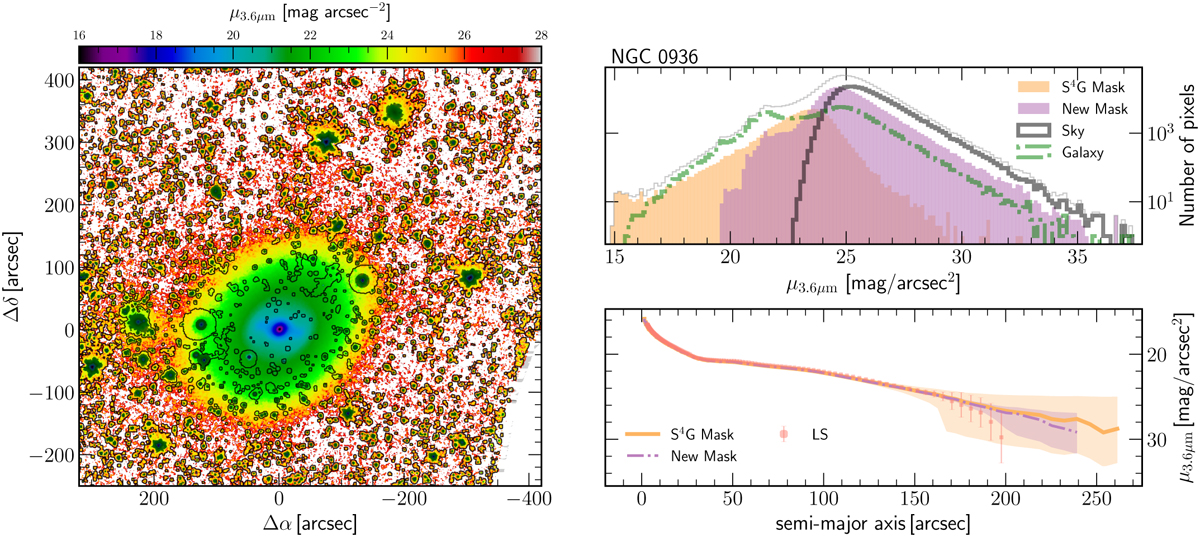
Difference between the masking of the original S4G and our new method. The left panel shows the surface brightness map in the 3.6 μm band of the galaxy NGC 0936 from the original S4G image. The shaded region represents the original mask of the S4G, while the black contour lines show the regions masked using the method explained in Sect. 4.2. The top right panel shows the histogram of the image (thin grey line) in surface brightness and the different contributions of the pixels in the original S4G mask (orange), the pixels added to the mask with the new method (purple), the pixels within the galaxy (green dotted line) and the sky pixels (black line), which are the pixels that are neither masked nor used to create the profile of the galaxy. The bottom right panel shows the surface brightness profiles in mag arcsec−2 using the original mask (orange line) and the new mask (purple dashed line). We also show the converted 3.6 μm profile (using the recipe from Sect. 5) using the Legacy Surveys (LS) imaging. The filled region represents the uncertainties due to the sky background subtraction.
Current usage metrics show cumulative count of Article Views (full-text article views including HTML views, PDF and ePub downloads, according to the available data) and Abstracts Views on Vision4Press platform.
Data correspond to usage on the plateform after 2015. The current usage metrics is available 48-96 hours after online publication and is updated daily on week days.
Initial download of the metrics may take a while.