Fig. D.1
Download original image
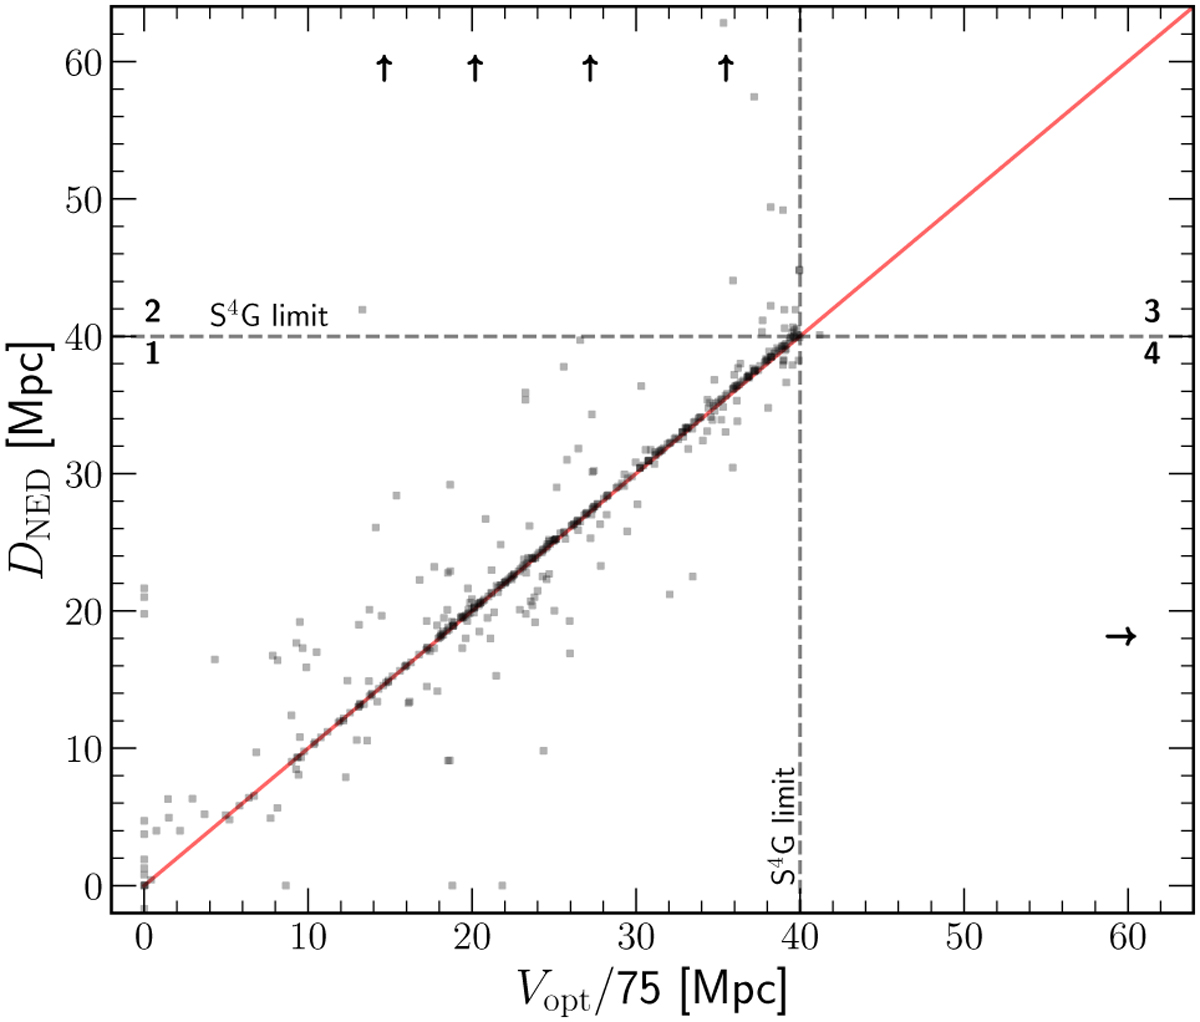
Comparison of distances. The x-axis shows the distances obtained using the optical velocities from the HyperLeda database. The y-axis shows the distances obtained from the NED database, a combination of redshift-independent measurements and redshift distances. The red line shows the one-to-one relation. The arrow shows galaxies with distances above the limits of the figure but located at the position of the other axis values. The dashed grey lines show the volume limit criterion of the S4G of 40 Mpc.
Current usage metrics show cumulative count of Article Views (full-text article views including HTML views, PDF and ePub downloads, according to the available data) and Abstracts Views on Vision4Press platform.
Data correspond to usage on the plateform after 2015. The current usage metrics is available 48-96 hours after online publication and is updated daily on week days.
Initial download of the metrics may take a while.