Open Access
Fig. 1
Download original image
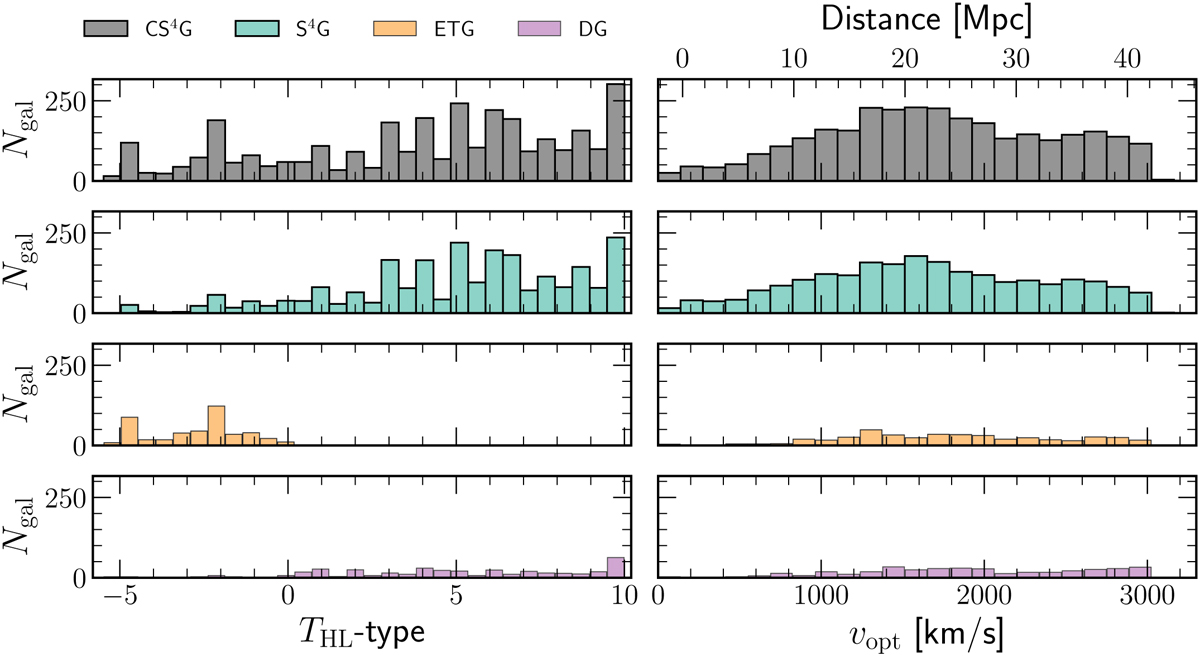
HyperLeda morphological type (THL, left) and optical velocity distribution (right) for all the samples. These values are queried from HyperLeda. From top to bottom, each row shows the distribution of the CS4G (grey), original S4G (blue), ETG (orange), and DG (purple) samples, respectively.
Current usage metrics show cumulative count of Article Views (full-text article views including HTML views, PDF and ePub downloads, according to the available data) and Abstracts Views on Vision4Press platform.
Data correspond to usage on the plateform after 2015. The current usage metrics is available 48-96 hours after online publication and is updated daily on week days.
Initial download of the metrics may take a while.