Open Access
Fig. 8.
Download original image
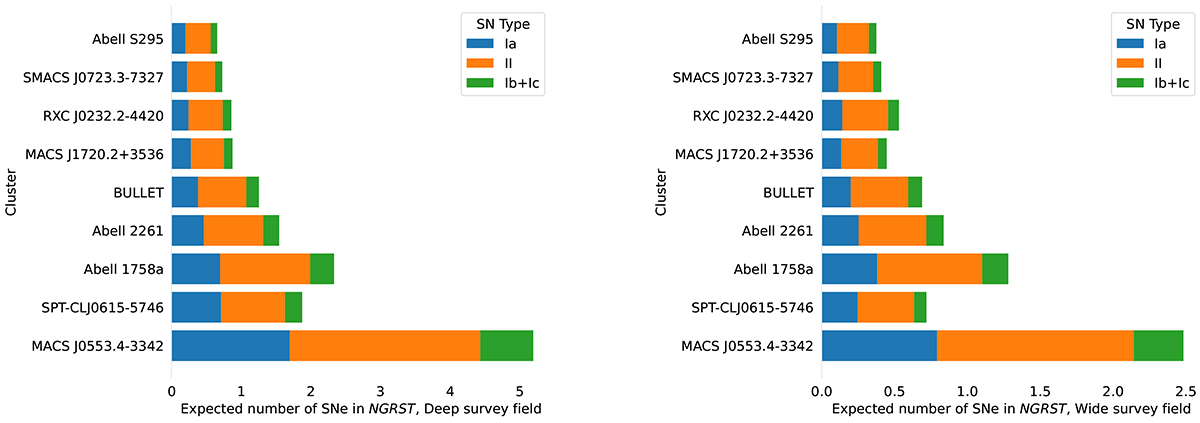
Expected multiply imaged SN yields for the clusters estimated volumetrically, for the Deep (left) and Wide (right) survey tiers of HLTDS. For visual clarity, we plot total yields for Type IIL, IIP, IIb and IIn SNe, and Type Ib and Ic SNe, grouped together.
Current usage metrics show cumulative count of Article Views (full-text article views including HTML views, PDF and ePub downloads, according to the available data) and Abstracts Views on Vision4Press platform.
Data correspond to usage on the plateform after 2015. The current usage metrics is available 48-96 hours after online publication and is updated daily on week days.
Initial download of the metrics may take a while.