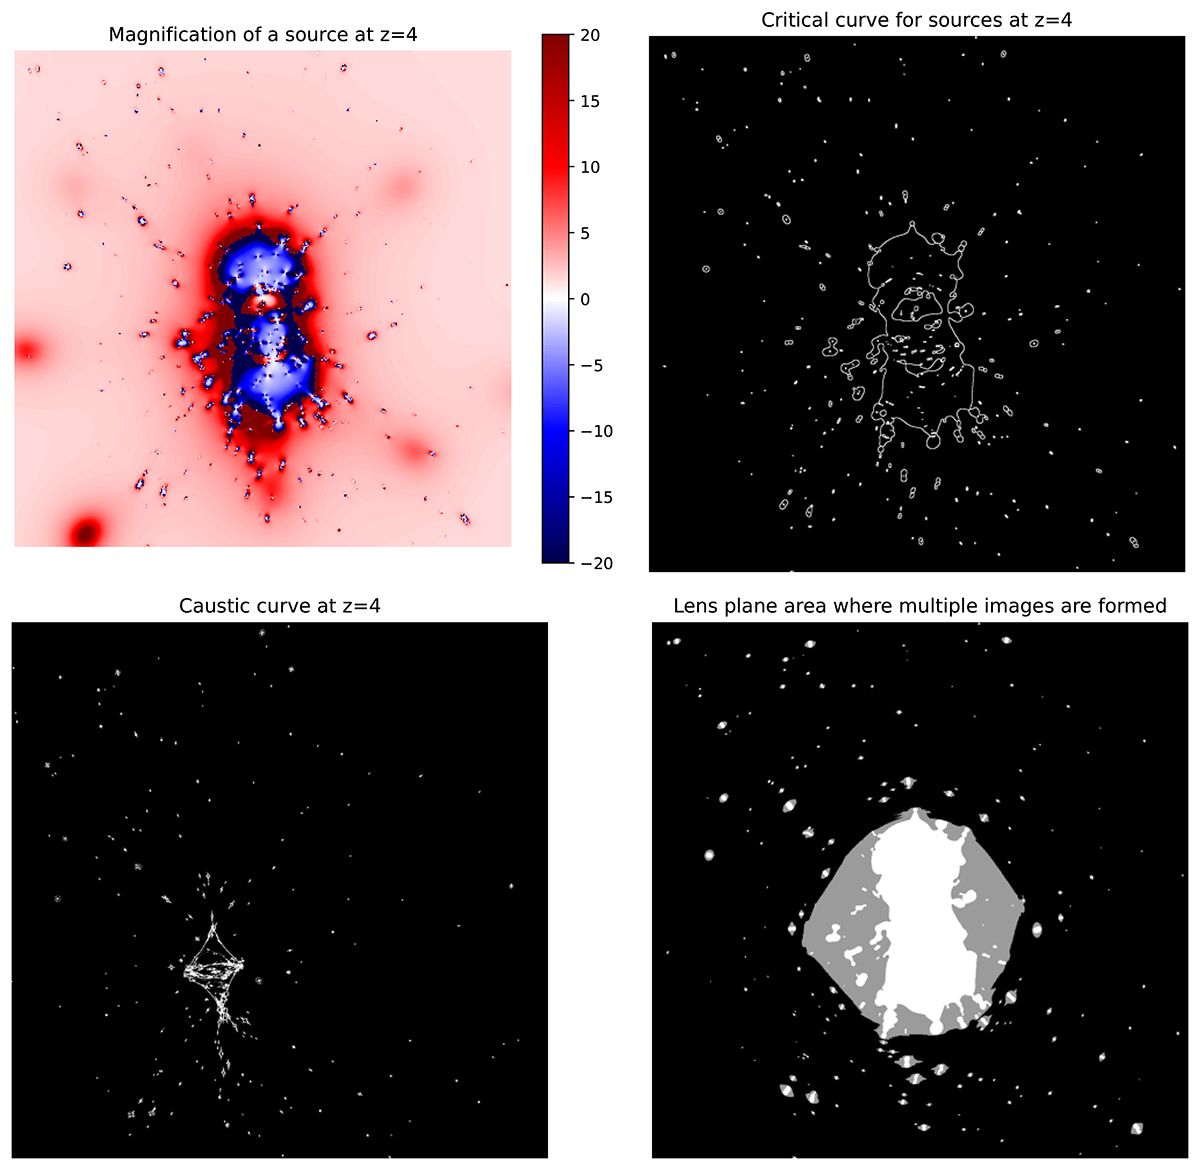
Fig. 6.
Download original image
Visualization of the volumetric estimate procedure. The plots are made based on model d1 FITS maps of Abell 370 by Niemiec et al. (2023), trimmed to a central 1500-pixel by 1500-pixel square for clarity for the three lens plane plots, the bottom left is trimmed to 1000 by 1000 pixels. The source plane is fixed to z = 4 in this example. Top left: magnification map for sources at redshift z = 4. Negative values have the interpretation of a change in parity, namely, the image appears mirrored. To compute changes in flux, the absolute value is used. Top right: The critical curve for a source plane at z = 4. The critical curve is found by tracing the line at which magnification μ approaches +∞ from one side, and −∞ from the other. This line mapped to the source plane is the caustic curve, shown in bottom left. Bottom left: Caustic curve for a source plane at z = 4. Sources within the caustic curve form multiple images, sources outside the caustic curve do not. Bottom right: lens plane area within the critical curve (white) and total area within which images belong to multiple image systems (white+gray). The latter can be obtained by tracing a ray for each pixel from the lens plane to the source plane, and checking whether the ray falls within or outside the caustic curve. This area is then used in our volumetric method, along with a magnification map, and a map of image multiplicity obtained through similar ray tracing method. We repeat this procedure for every source z plane of interest.
Current usage metrics show cumulative count of Article Views (full-text article views including HTML views, PDF and ePub downloads, according to the available data) and Abstracts Views on Vision4Press platform.
Data correspond to usage on the plateform after 2015. The current usage metrics is available 48-96 hours after online publication and is updated daily on week days.
Initial download of the metrics may take a while.