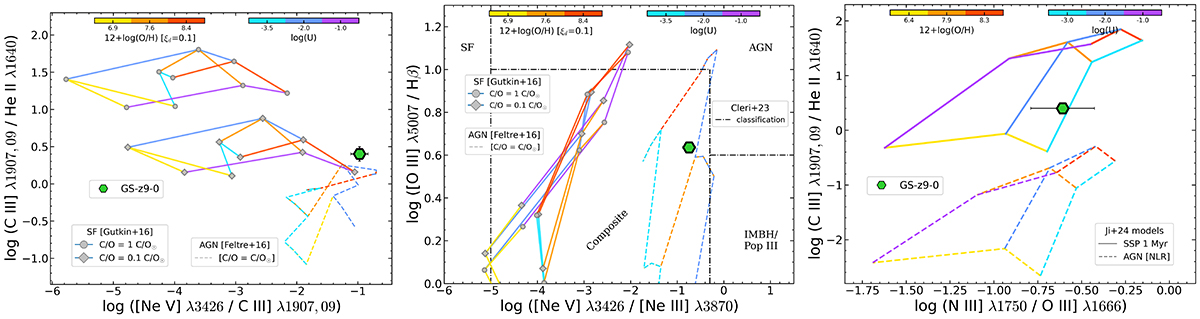
Fig. 9.
Download original image
Alternative diagnostic diagrams for GS-z9-0. The left and middle panels leverage the very high-ionisation (∼97 eV) [Ne V]λ3426 emission line, and the same set of models from Gutkin et al. (2016) and Feltre et al. (2016) as in Fig. 8. The diagram in the left panel (C3He2-Ne5C3) is sensitive to the C/O abundance, while the diagnostic considered in the middle panel (O3HB-Ne53) is not. Here, the location of GS-z9-0 is more in line with AGN-powered line ratios, especially in the [O III] λ5007/Hβ vs. [Ne V]/ [Ne III] diagram, where we show also the empirical demarcation lines between SF, AGN, and IMBH/PopIII models from Cleri et al. (2023). The right panel shows the C III] λ1909/He II λ1640 vs. N III] λ1750/O III] λ1666 diagram. The location of GS-z9-0 is compared with the set of photoionisation models for star formation (solid lines) and AGN/NLR (dashed lines) ionisation from Ji et al. (2024a).
Current usage metrics show cumulative count of Article Views (full-text article views including HTML views, PDF and ePub downloads, according to the available data) and Abstracts Views on Vision4Press platform.
Data correspond to usage on the plateform after 2015. The current usage metrics is available 48-96 hours after online publication and is updated daily on week days.
Initial download of the metrics may take a while.