Fig. 5.
Download original image
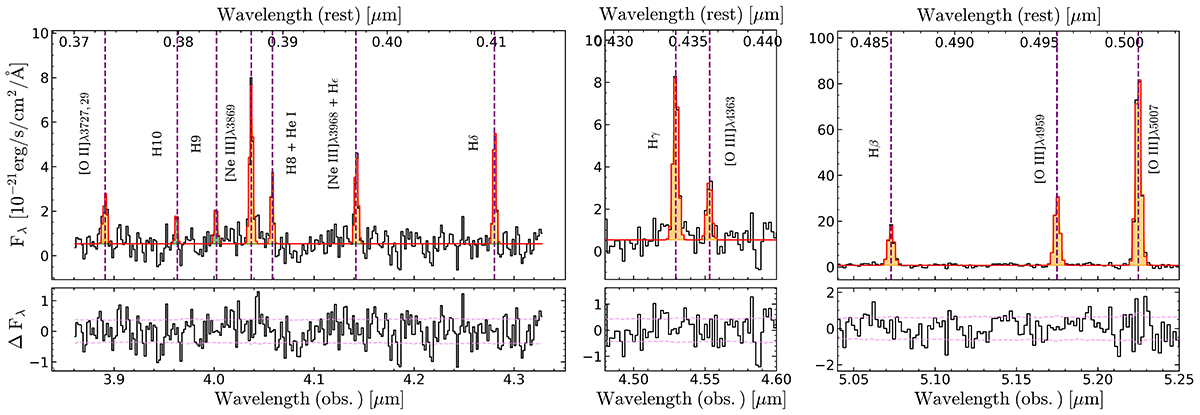
Rest-frame optical emission lines in the G395M medium-resolution spectrum of GS-z9-0. The best fit to continuum and emission lines is overlaid in red; detected lines are highlighted (in green marginal ∼3σ detections). The left-hand panel shows a zoomed-in image of the region between [O II] λλ3726,3729 and Hδ, highlighting the detection of both strong lines and fainter Balmer lines such as H9 and H10. The middle panel shows the region around Hγ and the [O III] λ4363 auroral line, while the right-hand panel highlights the high S/N detections of the [O III] λ4959,5007 and Hβ complex.
Current usage metrics show cumulative count of Article Views (full-text article views including HTML views, PDF and ePub downloads, according to the available data) and Abstracts Views on Vision4Press platform.
Data correspond to usage on the plateform after 2015. The current usage metrics is available 48-96 hours after online publication and is updated daily on week days.
Initial download of the metrics may take a while.