Fig. 3.
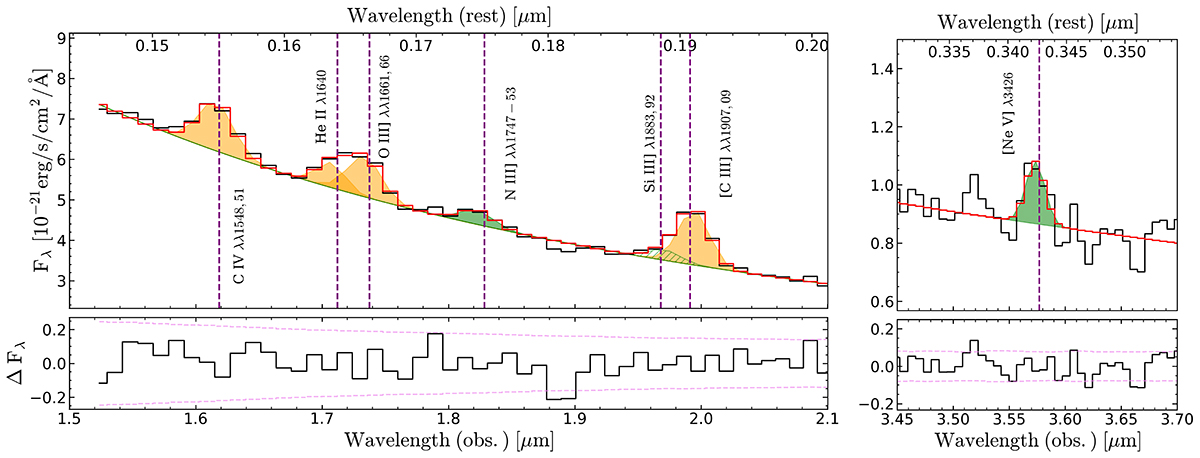
Download original image
Rest-frame UV emission lines in the PRISM spectrum of GS-z9-0. The best fit to the continuum and lines is shown in red. Detections at ≥4σ are marked in yellow, while marginal detections (∼3σ) are highlighted in green. The vertical purple lines mark the expected location of the emission lines based on the systemic redshift of the source. The bottom panels report the residuals of the fit and the 1σ uncertainty from the pipeline error spectrum. Left panel: Zoomed-in image of the region of the PRISM spectrum between 1.5 μm and 2.1 μm. In addition to clear detections of C IV, He II, O III], and C III], a marginal detection of N III] λ1750 is also highlighted. Right panel: Tentative detection of the very high-ionisation [Ne V] λ3426 emission line (ionisation potential 97.11 eV). The line is formally detected at ∼3σ from both the pipeline error spectrum and the bootstrapping approach described in Sect. 2.2.
Current usage metrics show cumulative count of Article Views (full-text article views including HTML views, PDF and ePub downloads, according to the available data) and Abstracts Views on Vision4Press platform.
Data correspond to usage on the plateform after 2015. The current usage metrics is available 48-96 hours after online publication and is updated daily on week days.
Initial download of the metrics may take a while.