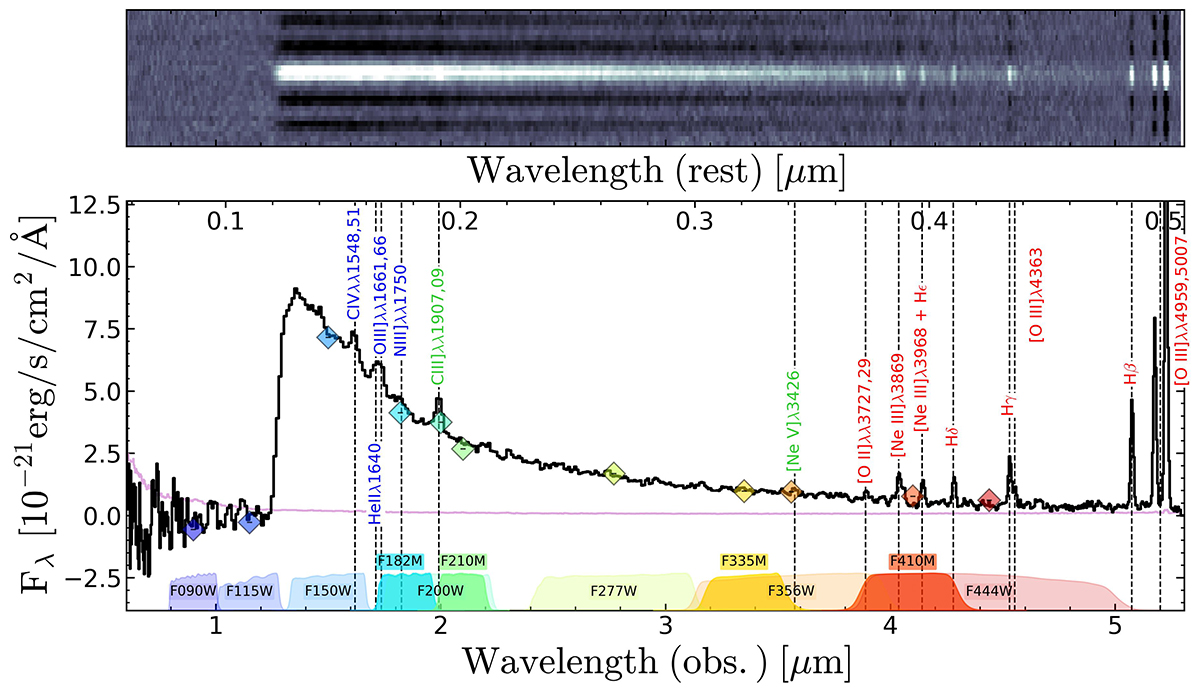
Fig. 2.
Download original image
PRISM spectrum of GS-z9-0 at z = 9.4327. The 2D (top) and 1D (bottom) spectra were obtained combining observations from the JADES 1210 and 3215 programmes. The pipeline error spectrum is reported in magenta. The main emission line features detected in the spectrum are marked in different colours, depending on whether they are also covered by G140M/F070LP (blue), G395M/F290LP (red), or observable only in the PRISM data (green). The FORECEPHO photometry extracted from available NIRCam wide- and medium-band imaging is also reported, showing good consistency in the flux calibration with the pathlosses corrected spectrum.
Current usage metrics show cumulative count of Article Views (full-text article views including HTML views, PDF and ePub downloads, according to the available data) and Abstracts Views on Vision4Press platform.
Data correspond to usage on the plateform after 2015. The current usage metrics is available 48-96 hours after online publication and is updated daily on week days.
Initial download of the metrics may take a while.