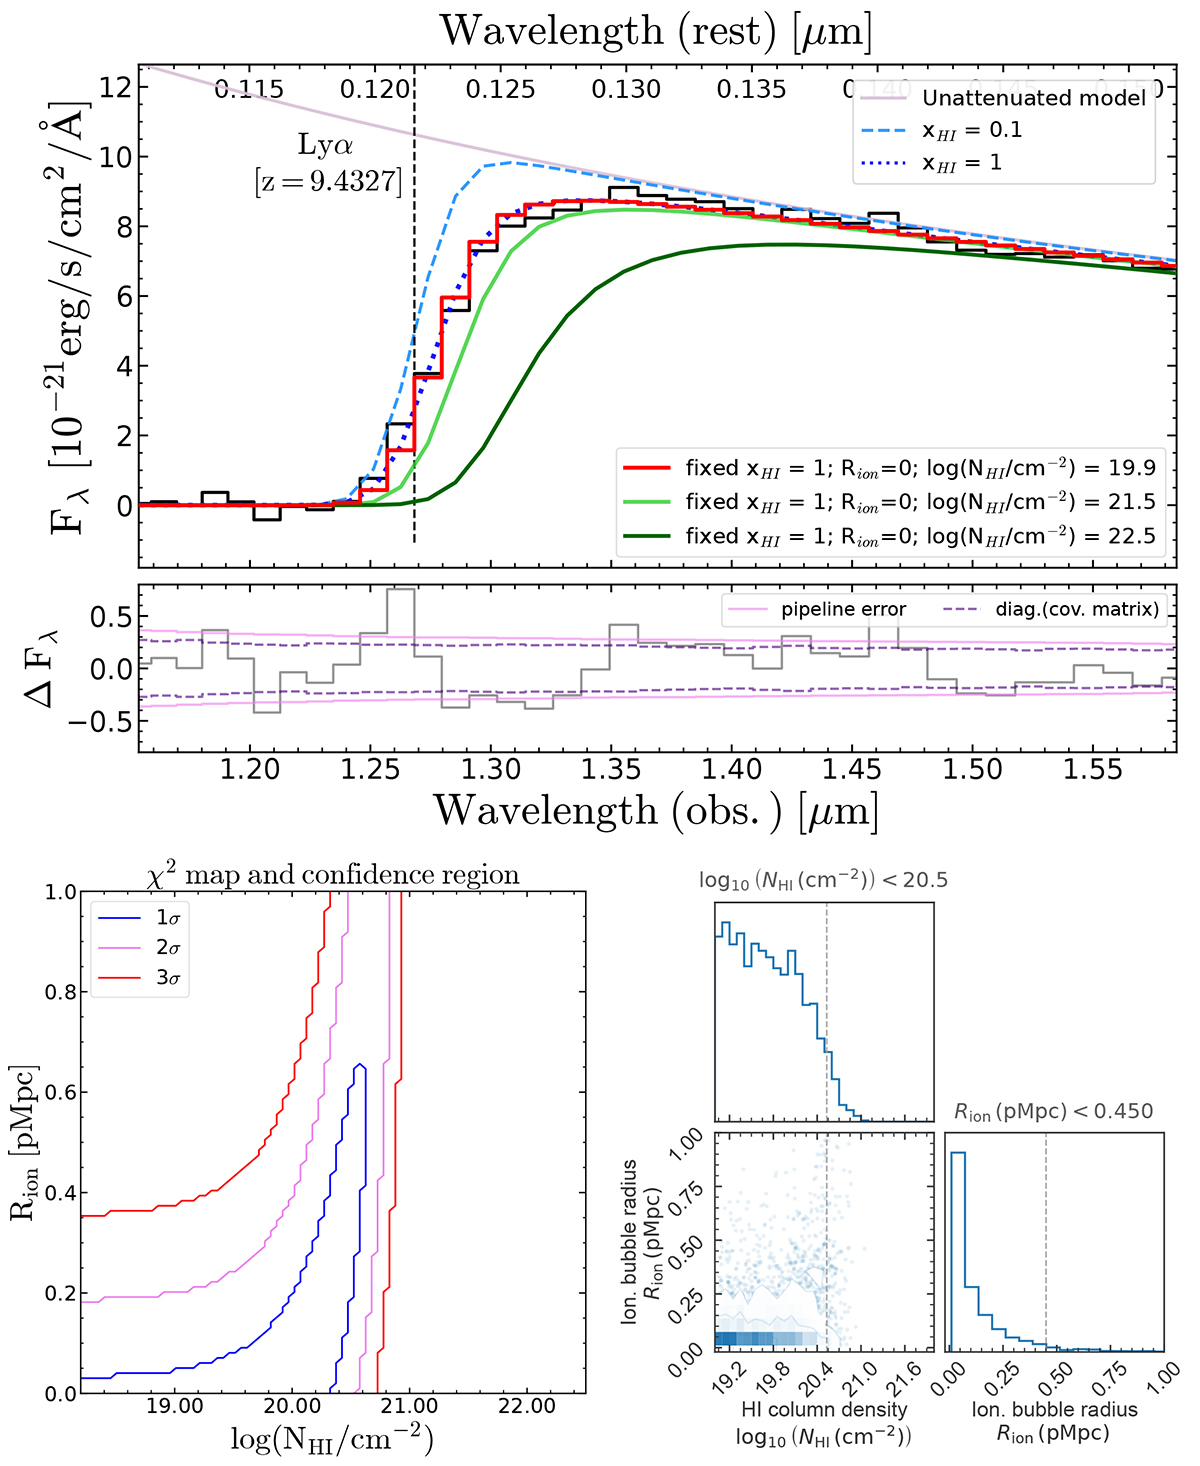
Fig. 14.
Download original image
Model of the Lyα break in the PRISM spectrum. Upper panel: Best fit (red line) from a model in which we attenuate a power-law spectrum by applying the transmission curve from a fully neutral IGM (xHI fixed to 1) while fitting for the size of any ionised bubble (Rion) surrounding GS-z9-0 and for the column density of a local DLA system along the line of sight (NHI). The residuals from the fit are compared with both the pipeline error spectrum and the square root of the diagonal terms of the covariance matrix described in Sect. 6 (Jakobsen et al., in prep.). The formal best-fit values provide Rion∼0 and log(NHI/cm−2) = 19.9. We note that including attenuation from the column density of neutral gas placed at the galaxy systemic redshift does not provide significant improvements to the model compared to only applying attenuation from purely neutral IGM (blue dotted line). For comparison, the light and dark green curves show the spectral shape obtained by including DLAs with log(NHI/cm−2) = 21.5 and 22.5, respectively. Bottom left panel: Contour levels of the χ2-map on the log(NHI) vs. Rion parameter space, highlighting 1σ, 2σ, and 3σ confidence regions. The column density of any DLA at the systemic redshift is constrained to log(NHI/cm−2) <20.75 at 99.7% confidence. Bottom right panel: Joint contours and marginalised posterior probability density function for the same parameters. The quoted upper limits report the 95th per centiles of the posterior distributions.
Current usage metrics show cumulative count of Article Views (full-text article views including HTML views, PDF and ePub downloads, according to the available data) and Abstracts Views on Vision4Press platform.
Data correspond to usage on the plateform after 2015. The current usage metrics is available 48-96 hours after online publication and is updated daily on week days.
Initial download of the metrics may take a while.