Fig. 12.
Download original image
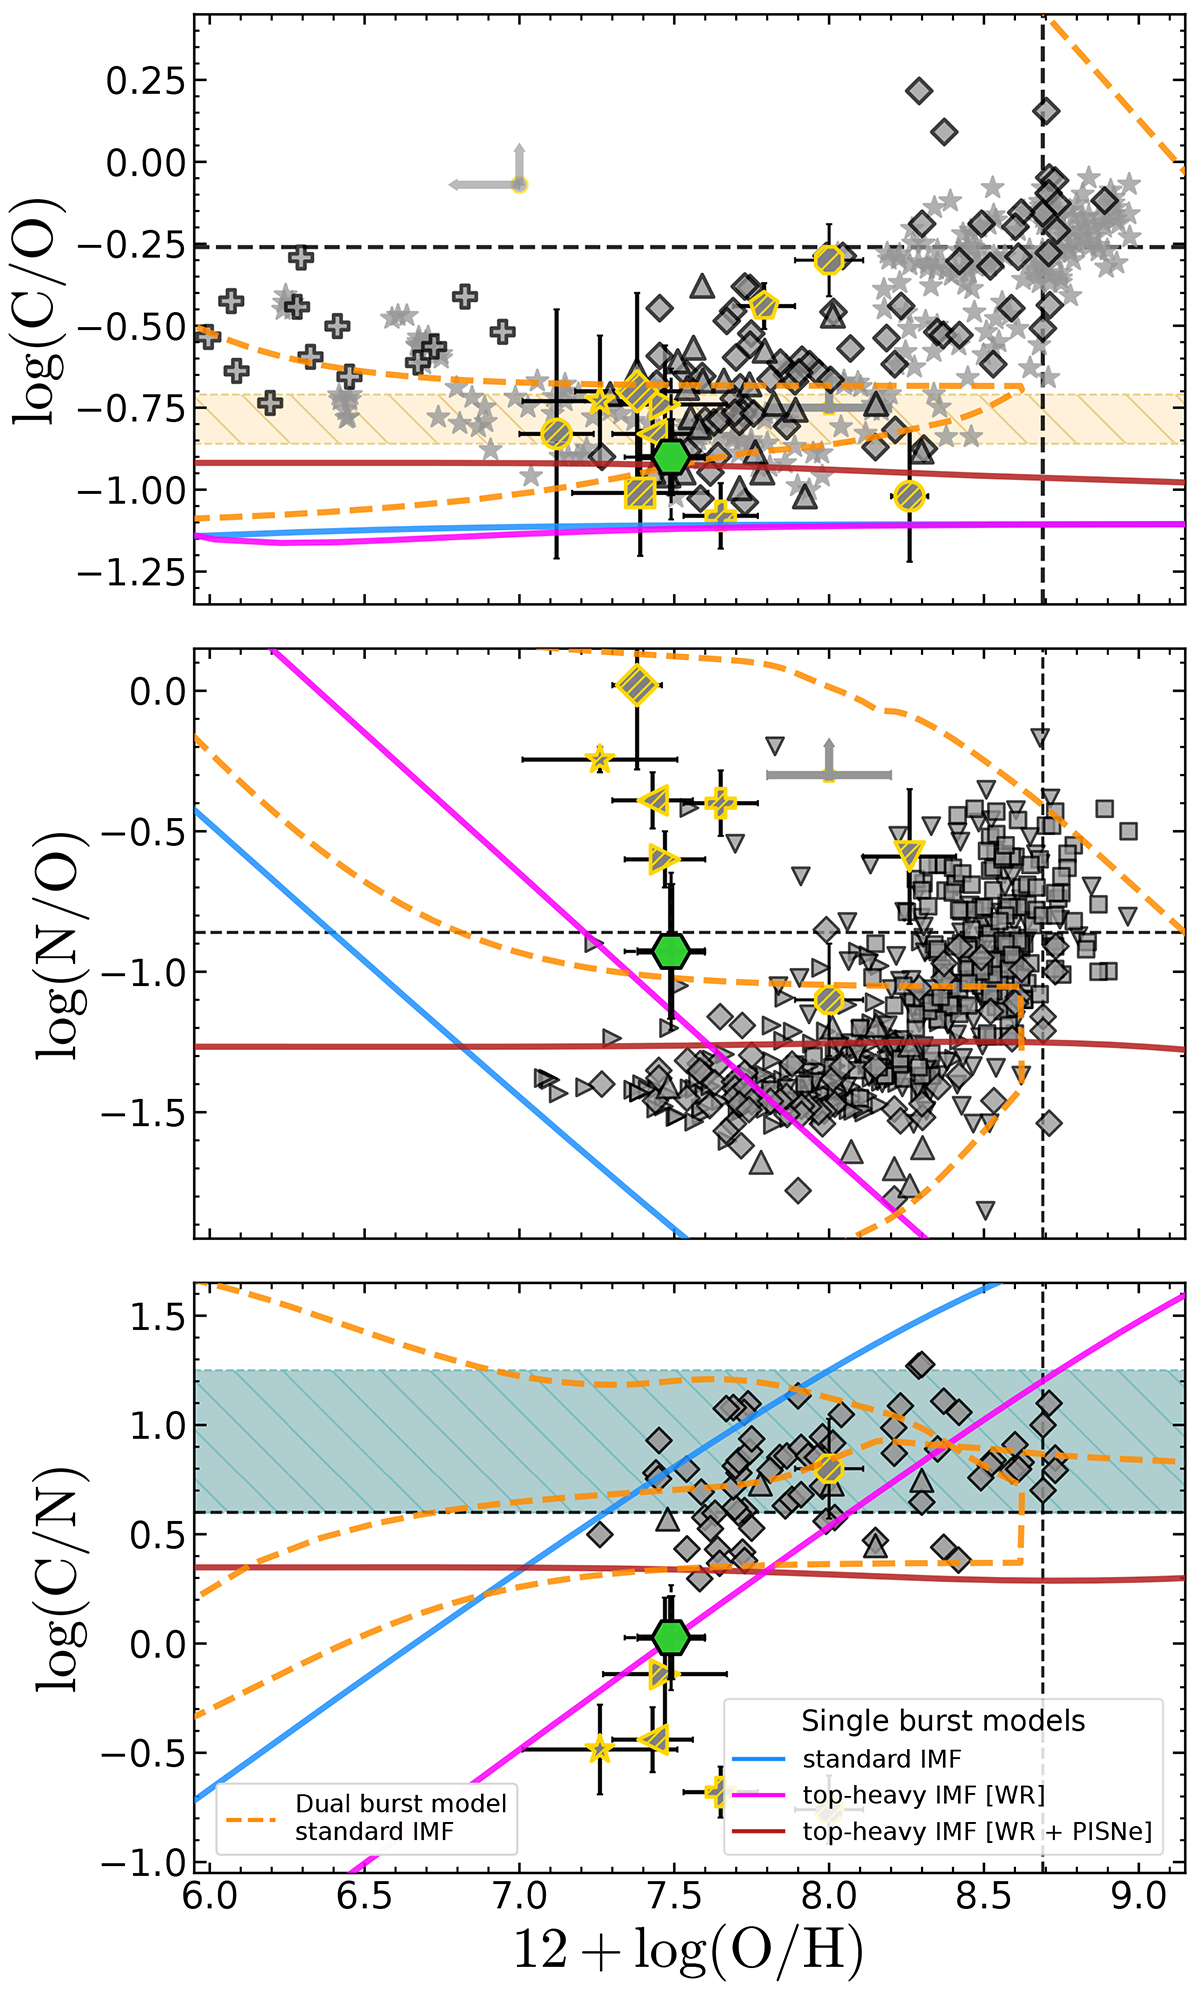
Evolution of CNO abundance ratios as a function of oxygen abundance for single starburst models with different IMFs, based on the framework of galactic chemical evolution models from Kobayashi et al. (2020). The symbols are as in Fig. 11, with GS-z9-0 in green and other high-z objects observed by JWST from the literature highlighted in yellow. Shaded regions in the C/O vs. O/H and C/N vs. O/H panels mark the range allowed by pure CCSNe based on the yields from Tominaga et al. (2007) and Watanabe et al. (2024), respectively. The blue model assumes a standard IMF (with high-mass end slope x = 1.3), whereas the magenta and red curves assume a top-heavy IMF (with flat slope) for massive stars in the range 30–120 M⊙ and 100–280 M⊙, respectively, with the latter including PISNe. For each model, the curve reaches the observed O/H in GS-z9-0 after 4.05 Myr. The combined CNO pattern of GS-z9-0 is better matched by models with underlying top-heavy IMF. In order to reproduce the abundance patterns of GS-z9-0 with a standard IMF, a more tailored double-burst model (with two bursts separated by 100 Myr, dashed orange line) is needed, similar to that proposed by Kobayashi & Ferrara (2024) to explain the nitrogen enhancement in GN-z11.
Current usage metrics show cumulative count of Article Views (full-text article views including HTML views, PDF and ePub downloads, according to the available data) and Abstracts Views on Vision4Press platform.
Data correspond to usage on the plateform after 2015. The current usage metrics is available 48-96 hours after online publication and is updated daily on week days.
Initial download of the metrics may take a while.