Fig. 11.
Download original image
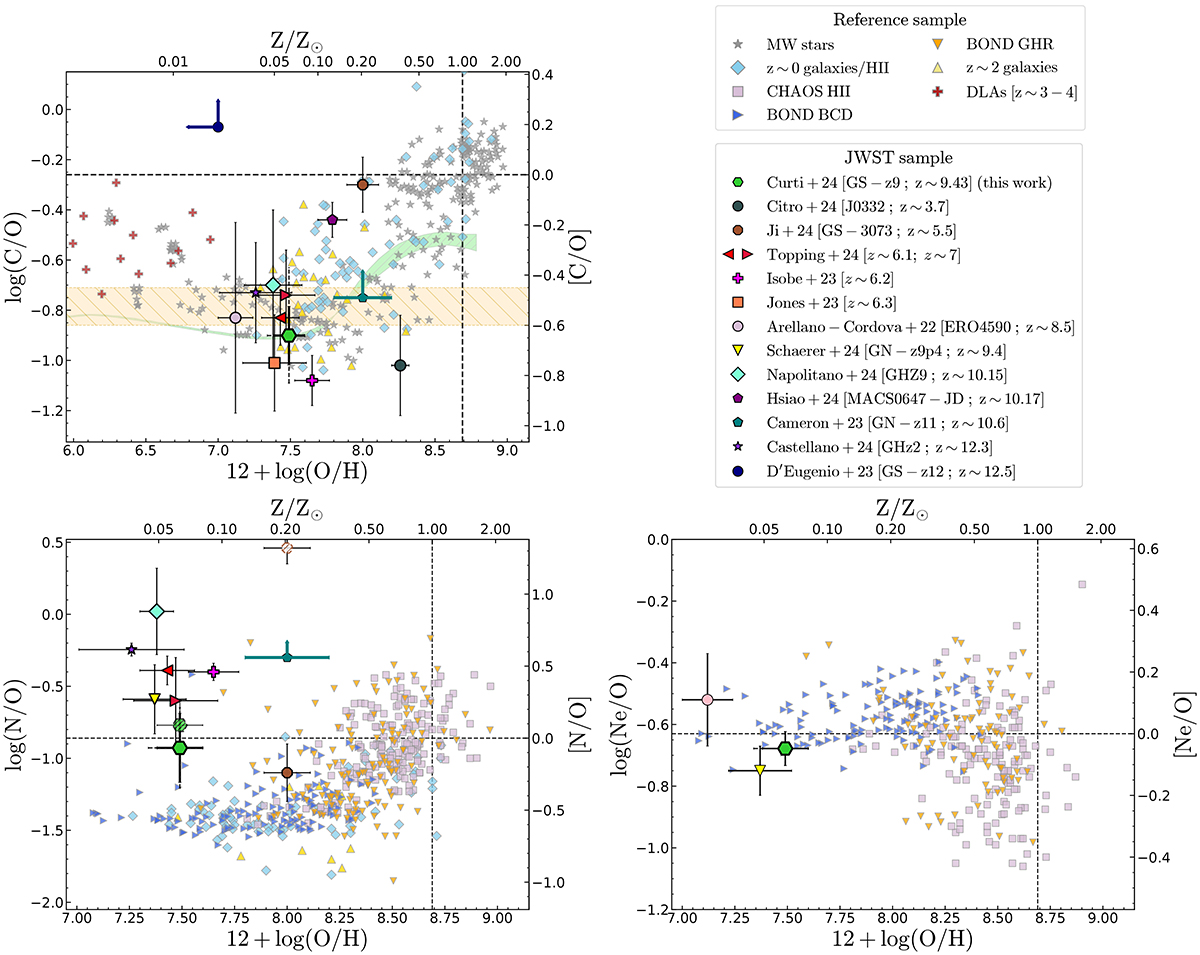
Chemical abundance patterns in GS-z9-0. The location of GS-z9-0 is marked by the green hexagon; the solid errorbars report the formal statistical uncertainties on our fiducial values and the dashed errorbars account for additional systematic uncertainties, as discussed in Sect. 4.6. The dashed black lines in the diagrams mark the solar abundance values. We compare GS-z9-0 with a compilation of recent abundance measurements in high-z galaxies from JWST, i.e. from Ji et al. (2024a) (plain marker for optical-based abundances and hatched marker for UV-based abundances), Topping et al. (2024), Isobe et al. (2023a) and Jones et al. (2023) at z∼6, Topping et al. (2025) at z∼7, Arellano-Córdova et al. (2022) at z∼8.5, Napolitano et al. (2024) at z∼10, Castellano et al. (2024) at z∼12, as well as upper limits on GN-z11 and GS-z12 from Cameron et al. (2023b) and D’Eugenio et al. (2024), respectively. We also include measurements in Milky Way disk and halo stars, local HII regions, local dwarf galaxies, z∼2 galaxies, and damped Lyman-alpha systems (DLA). Upper left panel: C/O vs. O/H diagram. The C/O abundance range predicted from type II SN yields from Tominaga et al. (2007) is marked by the golden hatched region, whereas the C/O vs. O/H pattern from Kobayashi et al. (2020) galactic chemical evolution (GCE) models is shown by the green sequence. The C/O level observed in GS-z9-0 is consistent with the enrichment expected from core-collapse SNe for a recently assembled, low-metallicity system. Bottom left panel: N/O vs. O/H diagram, reporting for GS-z9-0 both the N/O as inferred from the detection of N III] λ1750 in the PRISM spectrum and the C/N ratio (fiducial value, plain green hexagon), as well as that based on the marginal detection of N IV] λ1483 in the G140M spectrum (hatched symbol; see Sect. 4.4). The N/O measured in GS-z9-0 is higher than the plateau occupied by local galaxies and HII regions at low metallicity, although the nitrogen enhancement observed in this galaxy appears less extreme compared to other high-z systems recently observed by JWST. Bottom right panel: Ne/O abundance for GS-z9-0, which we observe to be consistent with the abundance pattern expected at low metallicity for α-elements. Additional references for literature points: compilation of MW stars (Gustafsson et al. 1999; Akerman et al. 2004; Fabbian et al. 2009; Nissen et al. 2014); compilation of z ∼0 galaxies and HII regions (Tsamis et al. 2003; Esteban et al. 2004, 2009, 2014, 2017; García-Rojas et al. 2004, 2005, 2007; Peimbert et al. 2005; García-Rojas & Esteban 2007; López-Sánchez et al. 2007; Toribio San Cipriano et al. 2016, 2017; Senchyna et al. 2017); HII regions from CHAOS (Berg et al. 2016, 2019b); blue compact dwarfs (BCD) and giant HII regions (GHR) from BOND (Vale Asari et al. 2016); z ∼2 galaxies (Fosbury et al. 2003; Erb et al. 2010; Christensen et al. 2012; Bayliss et al. 2014; James et al. 2014; Stark et al. 2014; Steidel et al. 2016; Vanzella et al. 2016; Amorín et al. 2017; Berg et al. 2018; Mainali et al. 2020; Matthee et al. 2021; Rigby et al. 2021; Iani et al. 2023); DLAs at z∼3−4 (Cooke et al. 2017; Saccardi et al. 2023).
Current usage metrics show cumulative count of Article Views (full-text article views including HTML views, PDF and ePub downloads, according to the available data) and Abstracts Views on Vision4Press platform.
Data correspond to usage on the plateform after 2015. The current usage metrics is available 48-96 hours after online publication and is updated daily on week days.
Initial download of the metrics may take a while.