Fig. 10.
Download original image
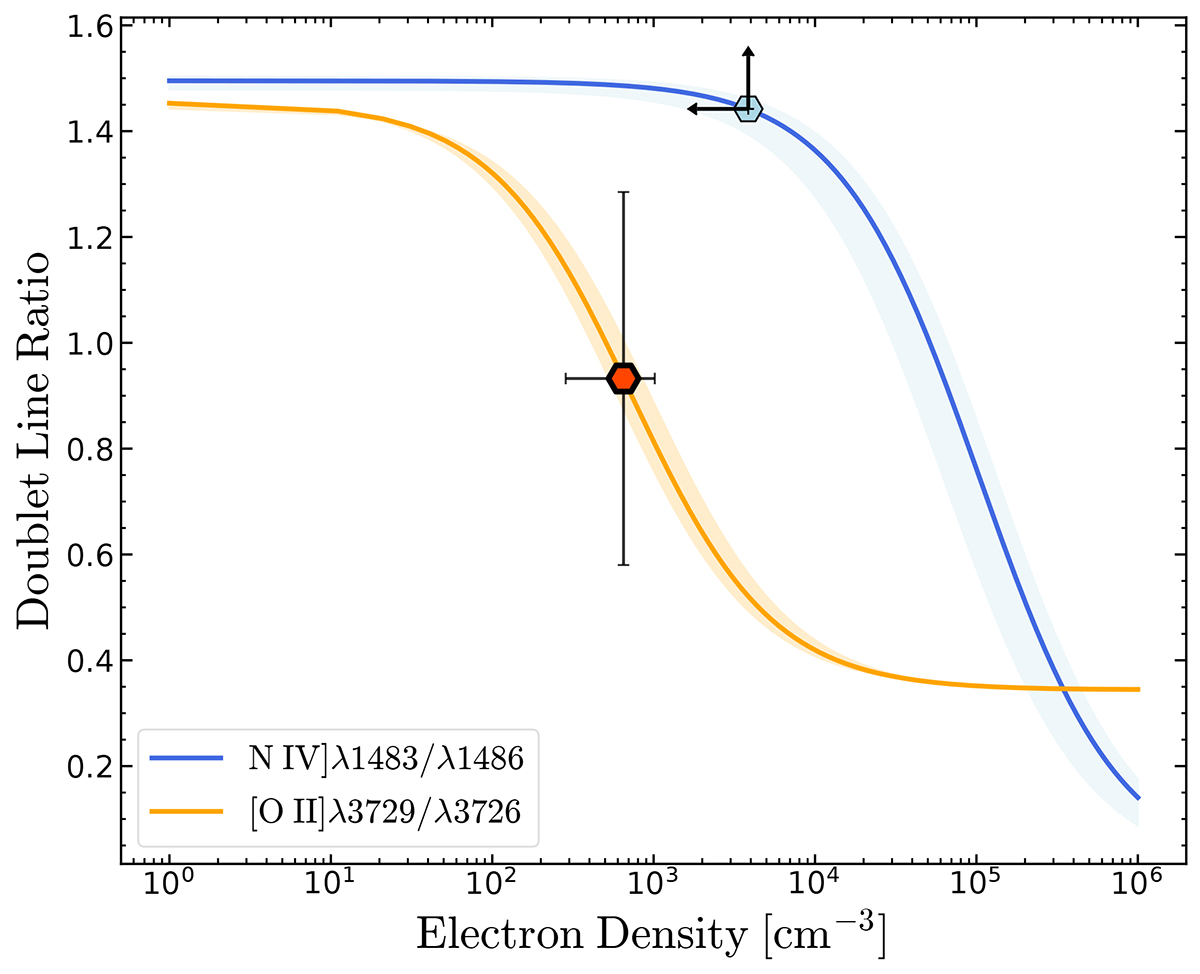
Electron density diagnostics. The [O II] λ3729/3727 ratio and the lower limit on the N IV] λ1483/1486 ratio, as well as the inferred electron densities, are reported as measured for GS-z9-0. The expected behaviour of the two line ratios as a function of density are depicted by the solid lines for Te = 2·104 K (with shaded regions spanning Te = 1−3·104 K). The lower limit on N IV] λ1483/1486 suggests no significant contribution from very high-density regions (ne≳104 cm−3), in broad agreement with the value inferred from the optical [O II] λ3729/3727 diagnostics.
Current usage metrics show cumulative count of Article Views (full-text article views including HTML views, PDF and ePub downloads, according to the available data) and Abstracts Views on Vision4Press platform.
Data correspond to usage on the plateform after 2015. The current usage metrics is available 48-96 hours after online publication and is updated daily on week days.
Initial download of the metrics may take a while.