Fig. 19
Download original image
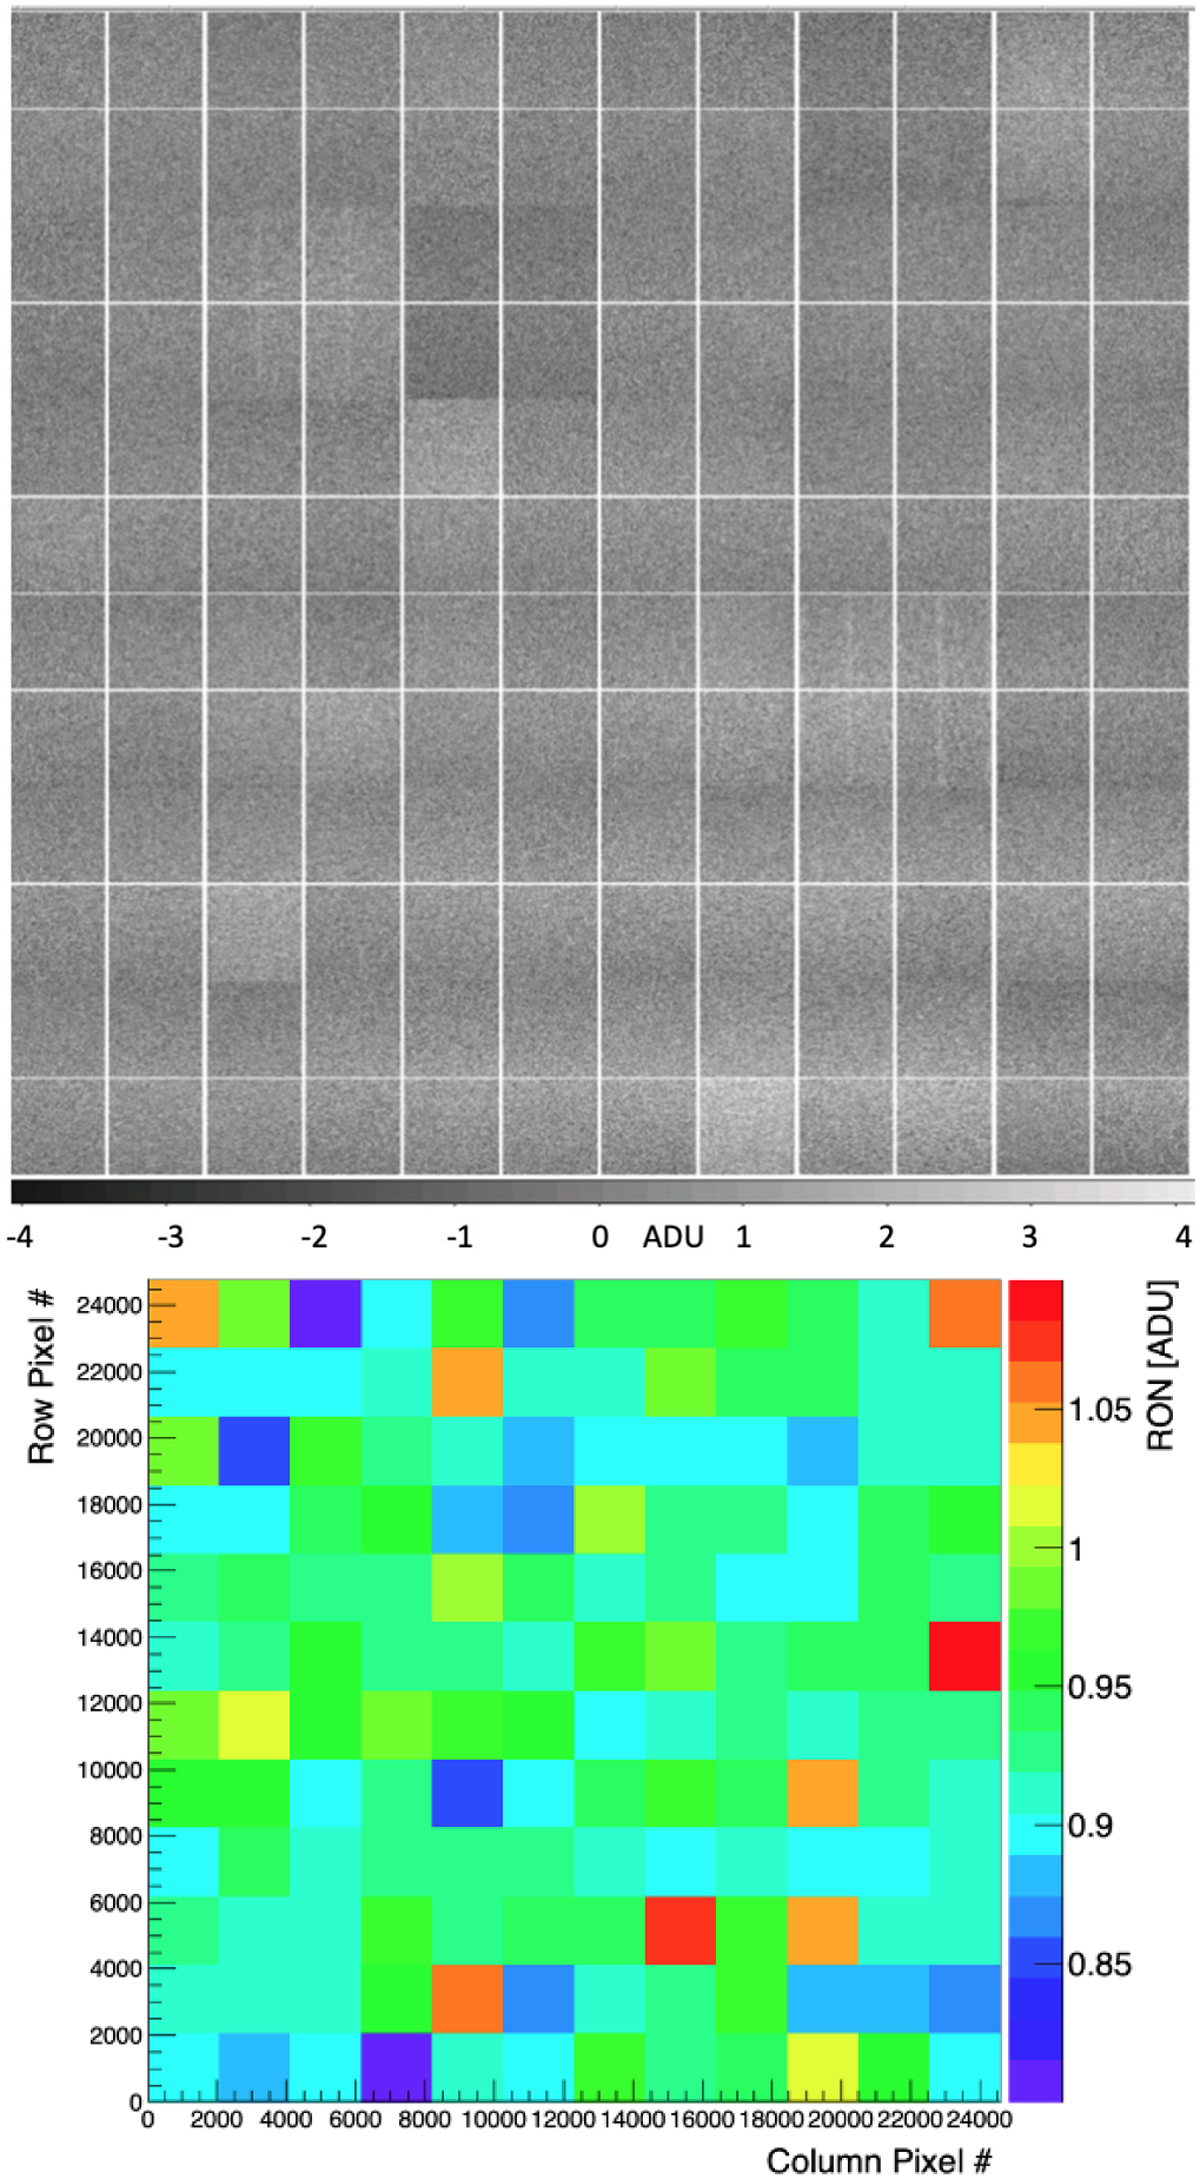
Payload-level testing. Top: bias image of the full 144 quadrants in the Focal Plane Array after processing to subtract mean levels. The greyscale bar is in analogue-digital units (ADUs) where the ratio of ADUs to electrons is the gain, so 1 ADU = 3.5 e−. Bottom: the readout noise per quadrant in the bias image for all 144 quadrants. Again, the colour bar is in ADU, so the readout noise in the worst quadrants is 3.8 e−, within the specification of 4.5 e−.
Current usage metrics show cumulative count of Article Views (full-text article views including HTML views, PDF and ePub downloads, according to the available data) and Abstracts Views on Vision4Press platform.
Data correspond to usage on the plateform after 2015. The current usage metrics is available 48-96 hours after online publication and is updated daily on week days.
Initial download of the metrics may take a while.