Fig. 5.
Download original image
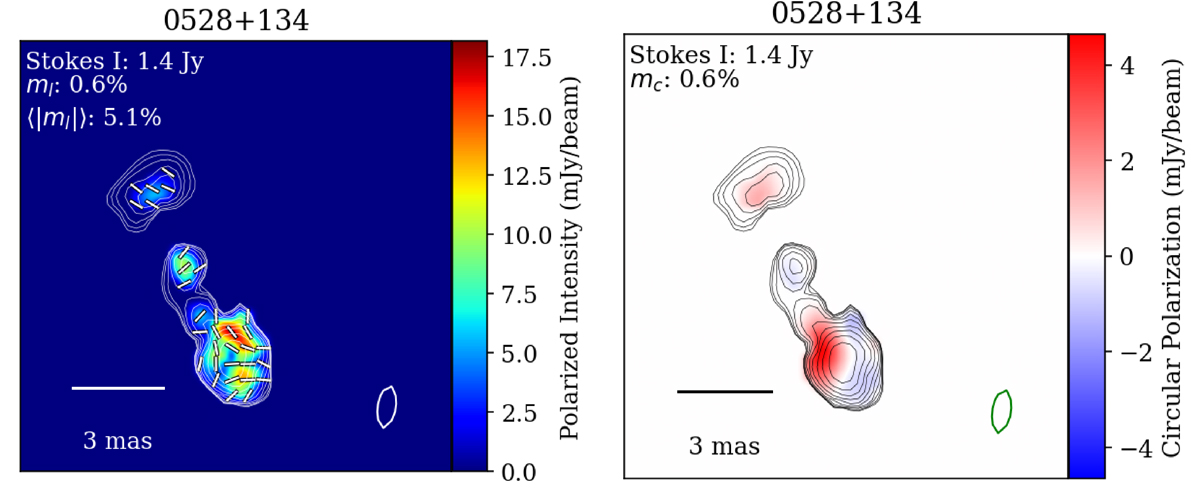
Reconstruction of data from 6–7 Jan. 2022 for the quasar 0528+134. The images show the resolved maps of: linear polarization at 15 GHz (color coding: blue-low and red-high) in the left panel. The total intensity is indicated in white contours. The linear electric vector position angle is plotted as white ticks. Right: circular polarization (colorcoding: blue-negative and red-positive). The total intensity is indicated in white contours.
Current usage metrics show cumulative count of Article Views (full-text article views including HTML views, PDF and ePub downloads, according to the available data) and Abstracts Views on Vision4Press platform.
Data correspond to usage on the plateform after 2015. The current usage metrics is available 48-96 hours after online publication and is updated daily on week days.
Initial download of the metrics may take a while.