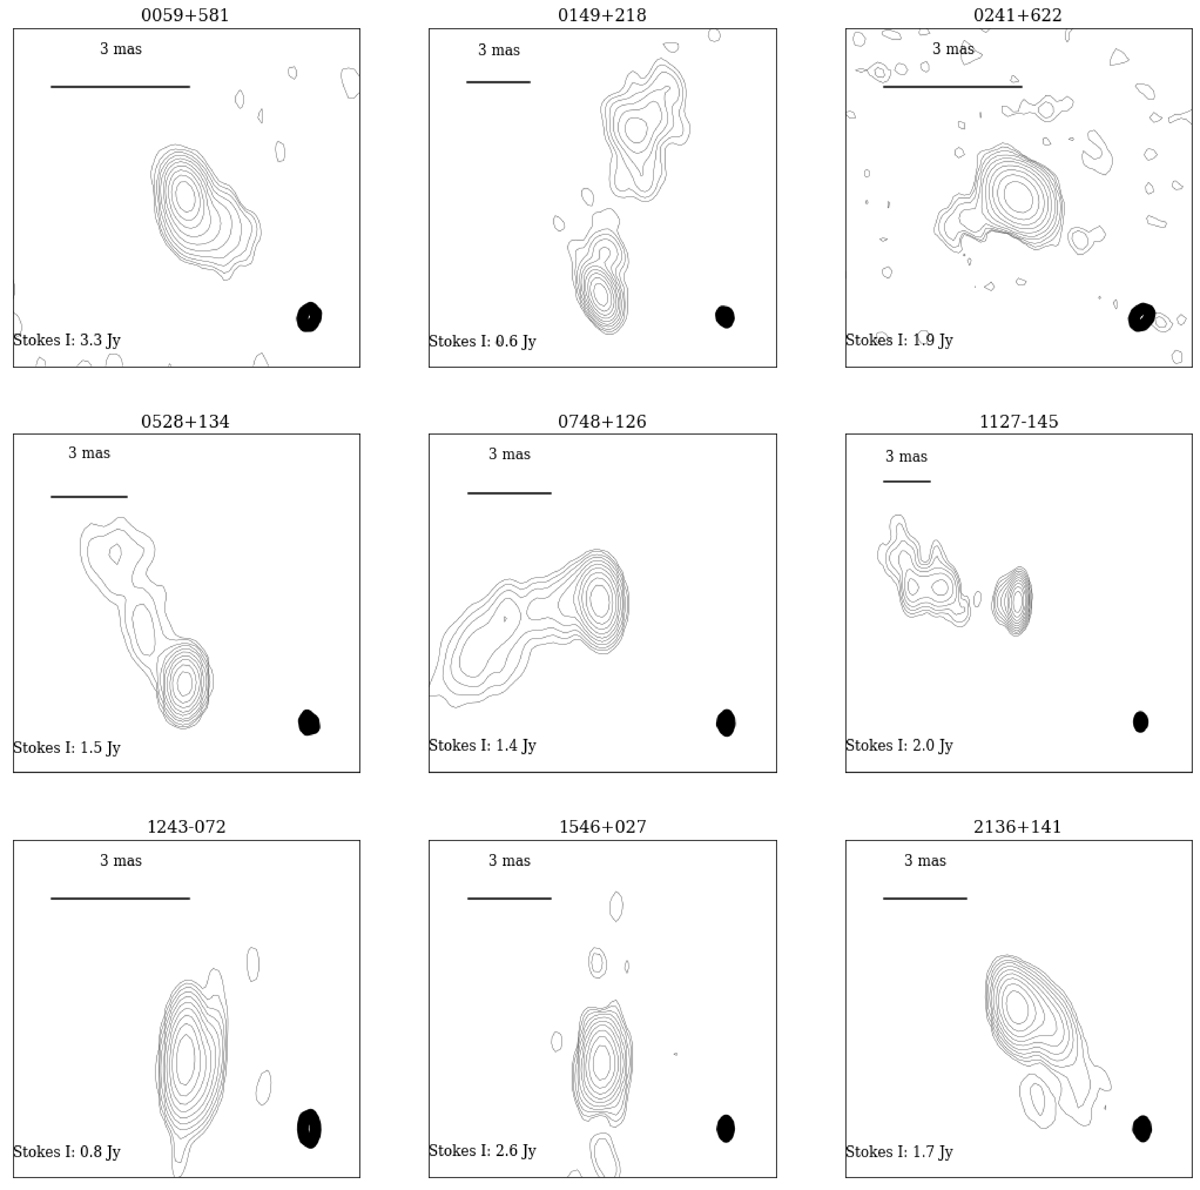
Fig. B.4.
Download original image
Same-level plotting comparison between CLEAN and DoG-HiT results: CLEAN. The conotour levels are [0.1%,0.2%,0.4%,...,51.2%] of the peak brightness emission. The convolution beam has been derived with uniform weighting and is shown in the lower left of the images. The scale of the image is shown in the top left with a bar of 3 mas in length.
Current usage metrics show cumulative count of Article Views (full-text article views including HTML views, PDF and ePub downloads, according to the available data) and Abstracts Views on Vision4Press platform.
Data correspond to usage on the plateform after 2015. The current usage metrics is available 48-96 hours after online publication and is updated daily on week days.
Initial download of the metrics may take a while.